Planning Fallacy
Planning Fallacy is a term proposed by Daniel Kahneman and Amos Tversky. In 1994, they asked 37 psychology students to estimate how long it would take to finish their thesis. The average estimation was about 34 days. Their “optimistic” estimates were around 27 days and “pessimistic” about 49. In fact, their actual thesis took them around 56 days and only 30% of them kept their own estimate.[i]
Later, in 2004, Magne Jørgensen and Kjetil Moløkken asked 12 software developers to provide 90% confident estimates for 30 already finished tasks. These developers had access to a small knowledge base and were informed about real effort after every estimation. In this experiment, Jørgensen and Moløkken received 360 estimates, and although “90% confidence”, the professionals included an average 64% of the actual effort for the first 10 tasks, 70% for the next 10, and 81% for the last 10 tasks. Summarizing, they were never even close to the assumed 90% confidence, despite providing the correct value after each attempt.[ii]
Estimating methods
Story points are a “golden standard” in agile projects. In fact, they are standard even in these projects which are not really agile. What’s even more interesting, you can’t find a single word about story points in the Scrum Guide. So, these points are common practice, a kind of habit.
They bring a lot of problems too:
- Hard to understand – What do we really estimate? Effort? Value? Time?
- Subjectivity
- Time consuming – Who did not participate in the session with a 1-hour long discussion and 1 task estimated at the end?
- Not clear for external stakeholders
- And, what’s crucial, there can be a pressure on more story points in the sprint and better velocity – if we notice here, how easily the Team can manipulate their estimates, it’s a ready recipe for a late project.
Therefore, to avoid the above issues, we can take some super simple metrics from Kanban frameworks. They don’t even require estimates from the Team:
- Lead Time
- Cycle Time
- Work-in-progress
- Throughput
In the long perspective, it should be okay to just calculate the number of tasks done by the team at the specific time, to predict the future. Simplifying the process and using the alternative metrics can be an answer for the planning fallacy mentioned, so common in teams.
But maybe there’s also a way to automate the entire planning process, not only estimating? Can math be helpful?
Monte Carlo Method
The Monte Carlo method, or Monte Carlo experiment, assumes that for complex problems, it can be hard to analytically solve them. Instead of that, we can randomly choose values representative for the process and repeat this several thousand times to receive an accurate result.
Circle field
Can the probability method really solve real problems? Let’s try. How many decimal places π do you remember? It’s 3,14159… And? Okay, forget about them for a while. What can you do if you totally forget what π is?
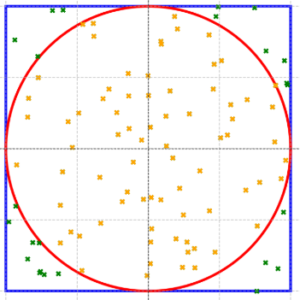
Draw a rectangle with a circle inside. Then, randomly place points inside the rectangle. Some of them are, obviously, inside the circle too.
This simulation can be executed with ChatGPT:
Prompt:

Draw a square and inscribe a circle in it. Then place 100 points randomly inside the square. Count how many of them are simultaneously inscribed in the circle.
For 100 points, we have 76 inside the circle.

To receive more accurate results, try for more attempts.
Prompt:

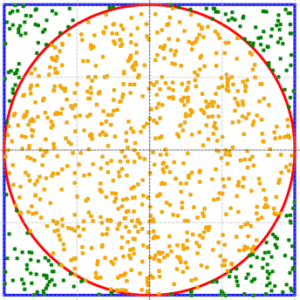
Repeat the experiment for 1000 points.
For 1000 points, we have 777 inside the circle.

So, using Monte Carlo method, we can say that the circle inside the rectangle covers around 0,78 of the rectangle field.
Let’s do some math:
0,78 = circle_field / rectangle_field
0,78 = π * r2 / (2r)2
0,78 = π / 4
π = 3,12
Pretty close?
German tank problem
The Monte Carlo method was used during the II World War. Allies needed to estimate how many tanks produced by the rival. It’s called “German Tank problem”. Every destroyed German tank had some elements with their unique ID numbers. These numbers were assigned in sequence. The most relatable IDs were found on gearboxes, but other parts were also analyzed. We can assume that tanks were destroyed randomly, so if we know that already destroyed tanks have id numbers:
[21, 25, 44, 56, 60, 72, 89, 134, 183, 249]
We can assume that this is a random sample from the produced tanks. Based on that, how many tanks have already been produced? In the next step, we can calculate the average difference between these ID numbers ordered in sequence. The differences between each consecutive pair of numbers are:
[4, 19, 12, 4, 12, 17, 45, 49, 66]
Avg difference = 25,33.
We just need to add this value to the highest number from the sequence, to receive an estimated number of all produced tanks.
249 + 25 = 274
How accurate was this calculation then? Allies calculations suggested around 270 German tanks on the battlefield in February 1944. According to German records, it was actually 276. Moreover, this data analysis allowed the Allies to understand how German tank production works.[iii] Taking into account the inflated propaganda values, the estimation brought tremendous value in the confrontation.
Monte Carlo method for estimating
If statistical methods work for estimating the value of π and the number of tanks on the battlefield, let’s try to use it in our everyday work.
The future is not certain and our estimates and predictions about that are not certain too. We can calculate that based on our velocity and estimates, we’ll deliver the product on a specific time. However, it can be ready a little bit earlier or later. So, what a chance that it’s ready on the deadline? Are you almost sure? Or is it just fifty-fifty?
There’s a solution to tell your Customer with established certainty that your project will be ready on a specific date. We have to use some math to calculate that.
First of all, you need some historical data. You can use story points, or Kanban approach with just the number of tasks done in the previous timeboxes (then, you don’t really need to estimate your Product Backlog).
In the previous sprints, your team has delivered the number of tasks or story points:
[7, 8, 10, 15, 3, 4, 11, 12]
We can assume that the future will be similar. Run simulation and randomly assign these numbers to the future sprint, as long as you assigned the expected number of sprints. In our test, we’d like to estimate how many story points we’ll deliver in the next 10 iterations. Single run is just a single possible vision of the future, based on your experience. You can run these a few times to see more possible options, and it can be done in any calculation tool. We did 15 simulations:

In the most pessimistic simulation, the Team will deliver in the next 10 iterations around 52 tasks or story points, in the most optimistic, 86. Median is 76 – we have a 50% chance to deliver no less than 76 in 10 upcoming iterations.
To be more precise, repeat this experiment 10000 times. As a result, you’ll have a Gauss curve representing a possible future. It’s called Monte Carlo simulation. If your expected certainty is really high, let’s say 90%, you have to reject 10% of the most optimistic cases to calculate the scope or deadline.
Summary
Estimating future projects doesn’t have to be guesswork. Even with a small sample of past data, you can calculate possible future scenarios. Moreover, you can even set an expected level of certainty and declare the deadlines for your project.
In the next article, we’ll try to build an AI assistant which will help you quickly plan your project and answer detailed questions of your customers in a second.
Sources:
[i] https://en.wikipedia.org/wiki/Planning_fallacy
[ii] https://link.springer.com/chapter/10.1007/978-3-540-24659-6_13
[iii] https://www.warhistoryonline.com/instant-articles/the-german-tank-problem.html


