Build a Data Pipeline Using a Modern Data Stack
A modern data pipeline, sounds fancy, don’t you think? If this modern data stack is a new term, please read the excellent blog of Guillermo Sánchez Dionis on Modern Data Stack The road to democratizing data
.
Recently at GoDataDriven we’ve organized a code breakfast, to have some food for thought in the morning. We’ve demonstrated how to build a pipeline using the modern data stack.
The purpose of the pipeline is that we’re building is to get all the metadata from the GoDataDriven Github organization. We would like to get this data periodically to analyze the usage, and see if we can spot any trends. For example, who’s working over the weekend by analyzing the commit timestamps.
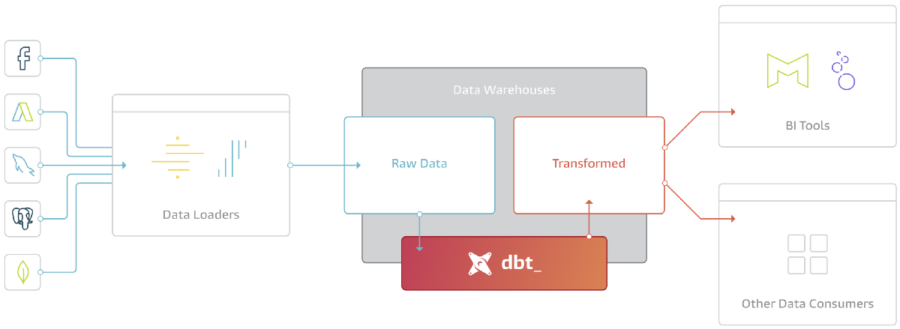
We follow the Extract Load Transform (ELT) principle here. This makes it easy to segment the parts in the pipeline:

Left hand side we see the Data Loaders, which is the process or service that loads the data from an external source into the Data Warehouse. The Data Warehouse represents the Load step. Following the Transformations using dbt where we slide and dice the data to distill the information that we need to make data driven decisions.
Extract
For the extract part we want to query the Github API to get all the data that we need. We could write a Python application that does this for us, package the application in Docker, and schedule it every night using Apache Airflow.
This sounds like a fun project, and probably it is. But it will take some time to get this all up and running. We have to write the application itself, write up the monitoring and alerting. Make sure that we handle edge cases, such as a new field being added in the API of Github. In the end, this can take up quite some time.

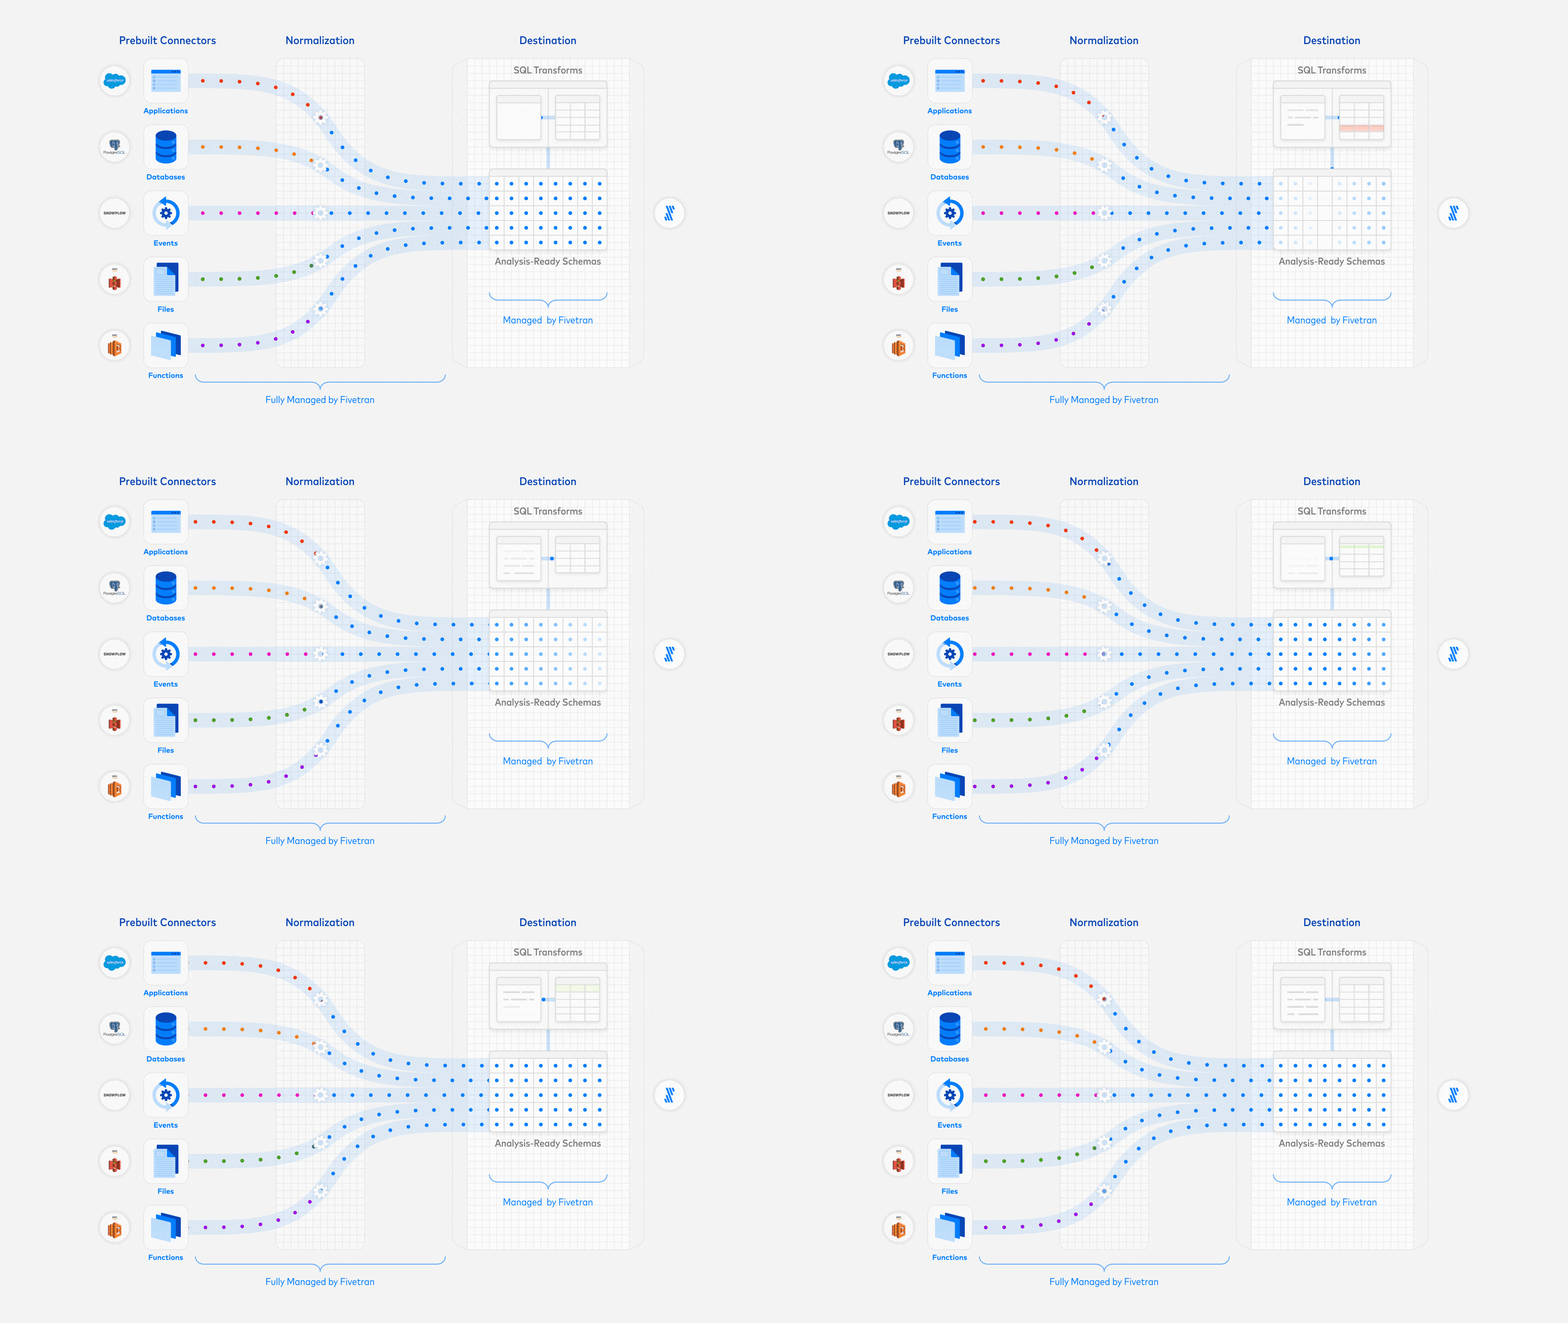
Instead, for the modern data pipeline, we leverage Fivetran to automatically ingest the data from Github into BigQuery. This requires little technical knowledge, and is setup in order of minutes, instead of days. You configure Fivetran using their portal, and most of the work is setting up authentication between the different services. Good to emphasize here is that there are no transformations being done to the data, this is all pushed down to the Transformations layer. Prerequisites to move to production like monitoring is setup by default. Furthermore, similar to many SaaS applications, you’ll pay per use. To get a good insights on the costs, you can use the 14 days free trial, and extrapolate from there.
What I find very important is that you ingest all the data onto the platform. This will increase costs a bit, because you’re loading data that you aren’t using, but this will contribute to the higher goal of data democratization. If the data isn’t there, it won’t be used for sure, and there is a barrier to ask for the data.
For the available connectors, please check out the Connectors Directory. Otherwise, you can implement a custom connector, while leveraging the features of Fivetran like monitoring and schema evolution.
Load
We load all the data into a cloud warehouse, in our case, BigQuery on Google Cloud. BigQuery is a managed Cloud Data Warehouse that supports tabular data. It is highly scalable, and you don’t have to manage the underlying storage or compute.
One thing that have managed data warehouses have in common is that it comes with a lot of functionality out of the box. For example:
- Support for
DELETEstatments to comply to Right to be Forgotten requests by users. This sounds trivial, but was traditionally not easy to do because of the immutable nature of the underlying storage. - Ability to do row- and column masking. This is also something that would not be easy to implement in traditional Hadoop based systems because the columns would be stored together physically in a single container format.
BigQuery is also pay per use, so you’re not paying if the cluster is idle or whatsoever. However, If you’re a power user, it might be interesting to switch to the flat fee model.
Transform
We have all the raw data into BigQuery, and we want to use this to slide and dice the data into easy to digest tables that can be shared with many departments within your organization. Typically this is where data build tool (dbt) comes in.
I believe dbt is a very powerful tool. In the past, Analytics would be done using some kind of GUI that would not support modern practices such as DevOps. dbt implements a data ops, where we can iterate towards data quality, using the best practices such as data testing, and integrated documentation. Having the documentation next to the code is essential, as when the pipeline gets extended, the documentation also has to be updated. This makes sure that the docs are always up to date, and not separate in some other system.
Below we see how dbt models the dependencies, by writing sql in conjunction with Python Jinja2 templating, you can build a dependency graph between sql files. All these files together form a full graph that will be executed by dbt. This makes it easy to add new sources, and integrate them into the existing pipelines.
dbt is opinionated in the way of working, and personally I believe this is a good thing if you potentially need to work with many different people on the same code base. dbt is SQL only, and you can add metadata, such as constraints or documentation using yaml and Markdown.
While incrementally improving you pipeline, you can work with many people together using Pull Requests and make sure that the pipeline is understood by the team, and that you’re on the same page.
In the demo we use dbt to compute some statistics from the Github data that we have sitting in BigQuery.
Video
Please watch the video where Misja Pronk is doing a walkthrough of the whole pipeline. Sit back and enjoy, or even better, code along!
You need a couple of prerequisites:
The steps are also in Github: code_breakfast_tutorial
If you run into any problems, please open up an issue on Github so we can see what’s going on. If you think this is something that you would like to implement within your organization, please reach out.


