Blog
AWS Open Source Observability - Amazon Neptune and Security Graphs (Part 2)

In the previous article from this series, I defined Observability as the set of practices for aggregating, correlating, and analyzing data from a system in order to improve monitoring, troubleshooting, and general security.
With CloudMapper, we have covered two use cases that are common and useful to most Cloud environments (security auditing and visualization). This article consists of a walkthrough describing the setup, creation, and querying of a graph database with the mentioned tools: a more niche, advanced use case on Amazon Neptune.
What is a graph database?
Since the concept of graph databases might be unfamiliar to some readers, we start with its definition. A graph database is a database structure focused on the relationships among its elements rather than the content of each element itself. It contains:
- Nodes: representations of each element and its properties. They symbolize real-life entities that are able to establish relations with others.
- Edges: representations of each relation between one or many elements.
Visually, they look like this:
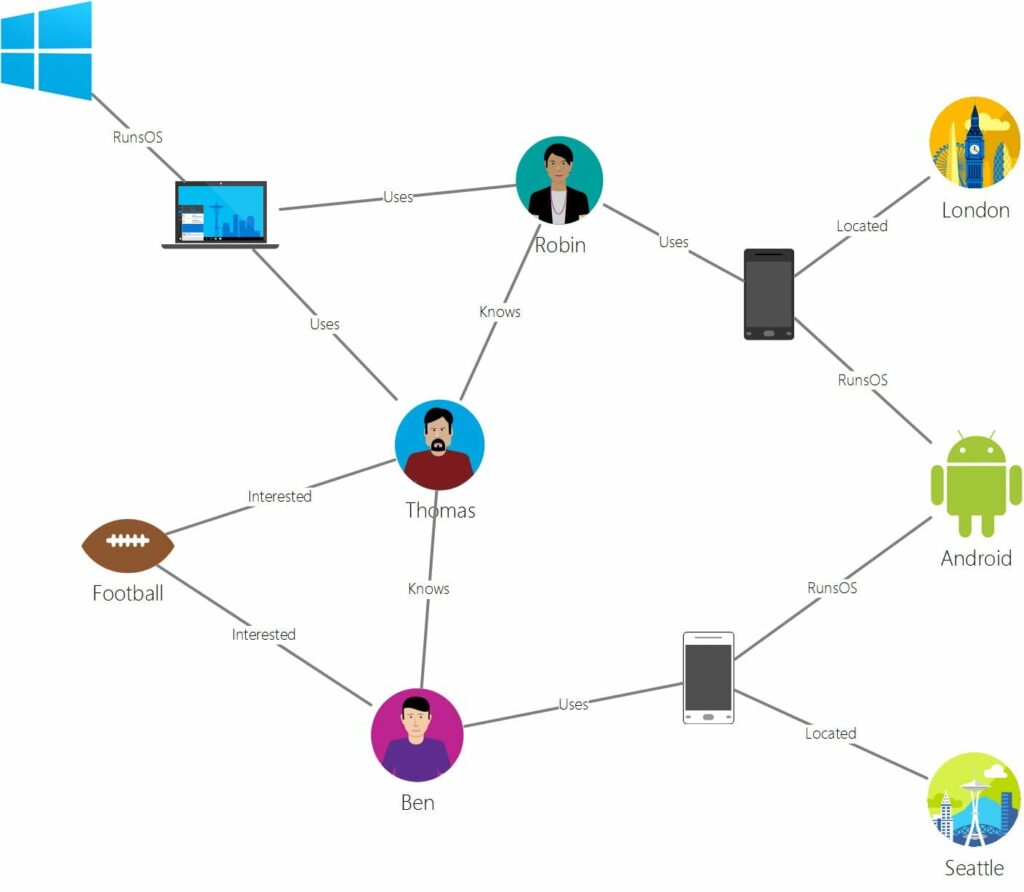
Robin, Android, or London are nodes with different properties such as age, version, or coordinates. Relations like “knows”, “interested” or “located” are represented by the edges of the graph.
These databases are often used in data analysis, particularly shining in fraud detection or social media recommendation engines. Nonetheless, they can be very useful for depicting relations between elements in a Cloud environment and improving its security posture.
Amazon Neptune is a managed graph database service offered by AWS.
Setting up the environment in AWS
This walkthrough assumes you are familiar with networking in AWS and can set up the corresponding ACLs, Route tables, and Security Groups for VPC/Regional reachability.
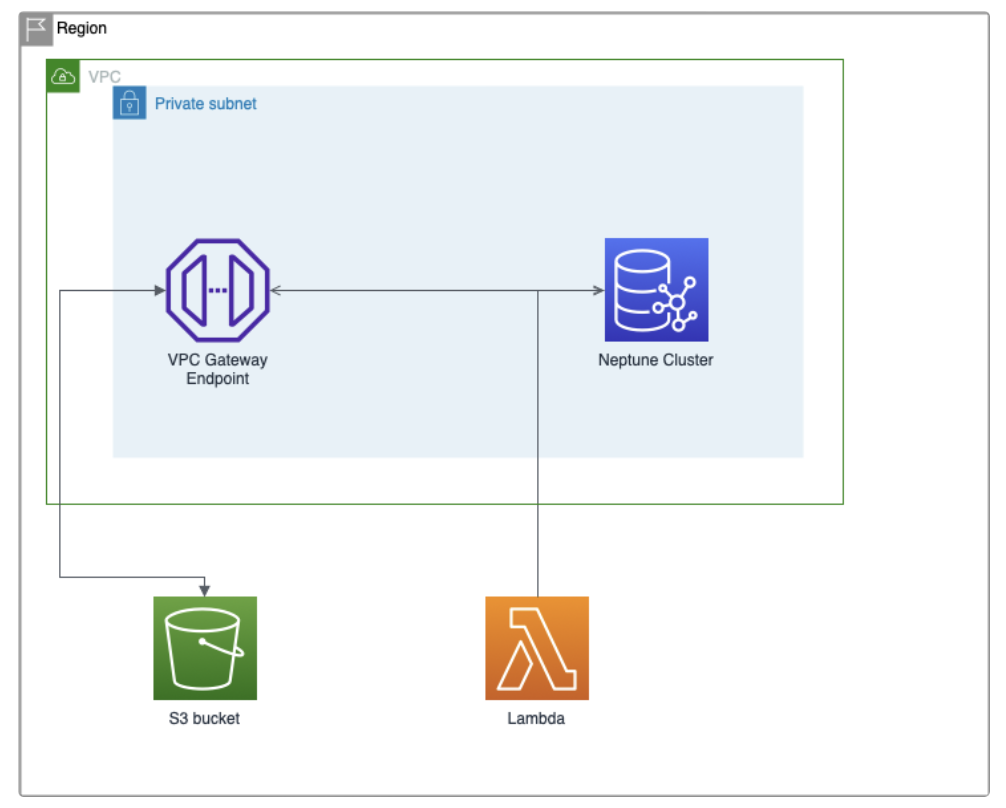
On a single region and VPC, you will need:
- A non-public S3 bucket, to store the database data in RDF format
- One subnet
- An Amazon Neptune cluster, with an instance located in the subnet. You can select non-production environments and a Free-tier eligible instance for staging. You can create it from the console, under the Neptune service, or use a CloudFormation template.
- A notebook instance for querying the database. You can create and configure it under the Neptune service.
- A VPC Gateway endpoint located in the subnet, to communicate with the S3 bucket.
- A Lambda function or EC2 instance that can communicate with the VPC endpoint and Neptune. We will use it to perform a POST request to load data from the S3 bucket into the Neptune cluster. If you use a Lambda function (and you should), you can use any language you feel comfortable with. I will be using Bash with the curl command.
Creating the Amazon Neptune cluster is well documented in the official User Guide.
Getting started with Amazon Neptune
Do not forget to create a service-linked role policy for Neptune as stated here:
Creating an IAM user with permissions for Neptune
Setting up Altimeter
You can install Altimeter via pip, as explained in its documentation.
A sample configuration file is provided in the repository, which you can use as a base for your own .toml configuration file. It is recommended that you edit the [regions] section to limit the scan to the regions you actually have deployments in. Leave the [preferred_account_scan_regions] as default, I have encountered some problems otherwise.
You will also need AWS CLI credentials configured, and the right level of privilege to read the elements you want to monitor. For example, in order to read information about an S3 bucket, you will need read access for S3 on such credentials.
Finally, and to avoid further documented errors, you will need to define the environment variable AWS_DEFAULT_REGION or have it configured in your .aws configuration path (by default ~/.aws/config).
Once this is set up, call the command:
altimeter <path_to_the_toml_config_file>
Altimeter will then populate an RDF file with all the relevant information regarding your environment and its relations. Extract the file with gzip -d path/to/file.gz. Double-check that no errors are present on the generated .rdf file (sometimes, instead of valid RDF text inside the file, you will see a Python error if something went wrong).
Importing data to the Amazon Neptune cluster
Once our RDF file has been generated, we will be importing it to our Neptune cluster. In order to do that, we first need to upload the content to S3. The easiest way is to upload it via Console, navigating to S3 → Your bucket and dragging and dropping the file to the interface.
When the file is uploaded, we need to perform a POST request against the Neptune cluster to import the data. You can do this from the Lambda function or an EC2 instance.
curl -X POST -H 'Content-Type: application/json' <NEPTUNE-ENDPOINT>:8182/loader -d '{"source":"s3://<S3-BUCKET-NAME>/master.rdf","format": "rdfxml","region":"<REGION>","failOnError":"FALSE","parallelism":"MEDIUM","iamRoleArn":"<NEPTUNE_ROLE_ACCESS_S3>","updateSingleCardinalityProperties":"FALSE","queueRequest":"TRUE"}'If you see a 200: OK response, the data will be loaded into Neptune. Wait a few minutes before continuing to ensure all data has been loaded.
An alternative to Amazon Neptune
If you want to continue without using Amazon Neptune, you can start a local instance of Blazegraph and work with it in your own environment.
Querying the database
Now we need to query the database to retrieve information about our environment. From the Amazon Neptune dashboard, and if you have not done this already, you must create a notebook instance. This will create an instance with access to Jupyter, a notebook managed service to perform queries to your graph database. You can do this interactively through the console as the process is self-explanatory.
Once the instance is created, you can select it from the ‘Notebooks’ menu and select the option ‘Open Jupyter’ in the Actions dropdown menu.
You will be forwarded to the Jupyter front-end menu. By default, a folder named Neptune will be present, with different sample notebooks to perform example operations in Gremlin language. While this is interesting for getting started and knowing more about how notebooks work, we will create our own.
Click on the top-right corner “New” dropdown button from the root folder, and add a folder named AWS Altimeter Visualization. Then, you can click on the same “New” button and create a Python 3 file, such as SampleQueries.ipynb included in the folder you just created.
Accessing the new notebook you will encounter this screen:
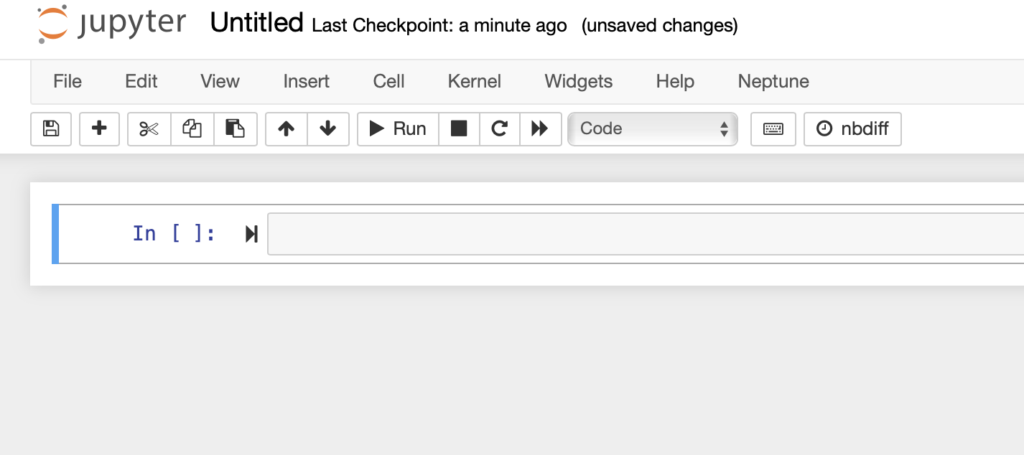
Notebooks use cells, which are editable format blocks. A cell can be a code cell, a Markdown cell, or a raw NBConvert. On the top menu, select ‘Insert’ and ‘Insert Cell Above’ or below. The ‘Cell’ section allows you to change between cell types. Code cells are executable blocks, while Markdown is useful to take notes and comments.
Let’s create now sample SPARQL queries. On a code cell, paste the following:
%%sparql
select ?launch_time ?ec2_instance_id ?sg_id ?public_ip_address ?from_port ?to_port
where {
        ?ec2_instance     a                                <alti:aws:ec2:instance> ;
                          <alti:id>                        ?ec2_instance_id ;
                          <alti:account>                   ?account ;
                          <alti:public_ip_address>         ?public_ip_address ;
                          <alti:state>                     'running' ;
                          <alti:launch_time>               ?launch_time ;
                          <alti:security-group>            ?sg .

        ?sg               <alti:id>                        ?sg_id ;
                          <alti:ingress_rule>              ?ingress_rule .

        ?ingress_rule     <alti:ip_protocol>               'tcp' ;
                          <alti:from_port>                 ?from_port ;
                          <alti:to_port>                   ?to_port

        FILTER (?from_port <= 22 && ?to_port >= 22)

} order by desc(?launch_time)
This will list the EC2 instances that have a public IP and port 22 is open. Clicking on ‘Run’ will prompt the results with information about each instance, in the case at least one is applicable.

You can find other sample queries in the official Altimeter documentation.
Conclusions:
What are the limitations?
As mentioned in the introduction, for many business use cases, proprietary software is the right choice. Altimeter has limited documentation and, while it provides lots of information, it is not easy to categorize and limit the output without trial and error.
Moreover, since it’s a community project, you may encounter incompatibilities or a lack of support for newer versions of dependencies. I ran into an error on my MacOS environment, where one of the dependencies of Altimeter had an outdated reference to collections.MutableMapping that had to be replaced for collections.abc.MutableMapping.
So, what can I do with this?
Altimeter provides an open-source alternative to easily populate a complex graph database with your Cloud information in a matter of minutes. Due to its complexity, most of the time other monitoring alternatives may be the right choice, but for cases where the information must be processed with artificial intelligence and/or machine learning, AWS Notebooks are integrated with Amazon SageMaker, being a possible path to explore. It is also useful to perform network analysis.
Since the way of feeding the database is through data contained on an S3 bucket, you can enable versioning to snapshot the state of a Cloud environment and perform historical analysis on certain points in time.
And finally, open-source means you can also extend Altimeter to be used in your internal projects. Perhaps a front-end to operate with it, API integrations with the graph database, or a dashboard solution for internal AWS accounts based on analytics data. This might be a great experimental tool for research teams with a related goal in mind and the requirement of being extensible, open, and cost-free.
Written by
Martin Perez Rodriguez
DevSecOps and Cloud specialist at Xebia Security
Our Ideas
Explore More Blogs


Contact