Previously, we’ve compared containerised applications using Amazon Elastic Container Service (ECS) and AWS Fargate. However, there are still more options to discuss!
Specifically, as you may remember, apart from these two services mentioned above, our Proof of Concept (PoC) also involved testing Amazon Elastic Container Service for Kubernetes, which can be shortly refereed as Amazon EKS. This is what I want to talk about today – to assess the validity of Amazon EKS for the same purpose!
A Quick Recap
In case you need a brief reminder, our PoC’s business case involved a (hypothetical) photography company that desired to extend its portfolio with photo editing services. The company’s clients, based around the globe, could upload large numbers of pictures to process – they have assumed that there won’t be more than 10 thousand of images to process in any one 30-minute time frame. This should be treated as the extreme edge case that the system would experience.
Furthermore, the photography business would like to have infrastructure that is able to work effectively when there is a massive amount of uploads and, similarly, does not wish to overpay for infrastructure at night, as there are not many images to transform at that time. And, of course, customer also wants to quickly implement this new solution and reduce their time to market.
The company have heard about using a Cloud solution and would like to use such features, but how does it work for the end user? After editing an image, both the original and transformed versions should be downloadable - as long as users don’t delete them. The first solution that comes to mind is serverless computing, using AWS Lambda, but the business isn’t ready for such innovation. For the purpose of transforming images, the company has already built three containerised applications – all designed to process large numbers of images.
Their three purposes are:
- to convert to the grayscale intensity,
- to add a watermark to the pictures,
- to generate a thumbnail.
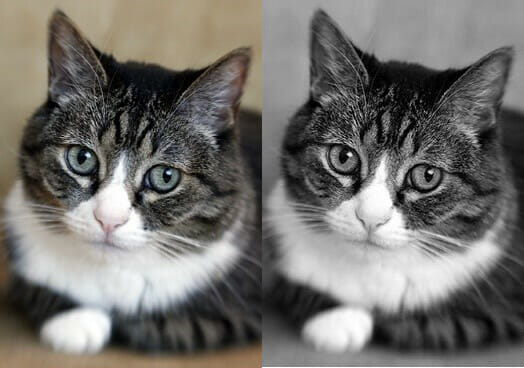 Figure 1 An image before and after conversion to grayscale[/caption]
 Figure 2. An original image and an image with a PGS Software logo as a watermark[/caption]
 Figure 3. An original image and a thumbnail[/caption]
Our main goal was to build a Cloud infrastructure that meets the following business requirements:
- uploading and downloading a large number of images to a durable storage solution,
- processing 10 thousand images in less than 30 minutes,
- using the existing containerised applications, depending on the traffic, to reduce costs by effective infrastructure utilisation,
- saving images after transformation, as long as they are kept on the system.
Adapting for Amazon EKS
For Amazon EKS, there were no changes in the concept of use case nor architecture as a whole, so the decision about extracting this scenario was mainly motivated by the way Kubernetes handles the replication of containerised application instances. ECS and Fargate autoscaling groups were configured to adjust desired tasks count up or down in response to CloudWatch alarms. Based on the number of messages available for retrieval from the SQS queue, tasks were added or removed from the services where, in EKS, we used a Kubernetes Metrics Server to collect resource utilisation data for containers horizontal scaling. In our opinion, this difference was crucial enough to create another blog post – and here it is!
An Introduction To Kubernetes
Kubernetes (abbr. k8s) is an open source platform that makes the management of containerised applications easier, but it also handles scaling and automates deployments. While this serves as a good general description, let's take a closer look and point out features that distinguish k8s from the others:
Service discovery and load balancing
There is no need to use any external and/or unknown service discovery mechanism. Every Pod (if this does not sound familiar, then think about it as a container – I will describe Pods later) gets its own IP address and a single DNS name for a set of containers with the same application. It can also load-balance traffic across them.
Automated bin packing processes, based on workload and utilisation
Kubernetes places containers without any help. It uses application resource requirements and other constraints, while not losing out on availability.
Storage orchestration
You can use a storage system of any type you want, either mounted locally, on a public cloud provider like AWS, or a network storage system, such as a Network File System (NFS), which is a very common option.
Self-healing ability and deployment rollouts
K8s monitors the deployed infrastructure and quickly takes action if it spots any failures, or if any Pod doesn’t respond health checks (that are defined by the user). Even if a Worker Node dies, you do not have to reschedule containerised applications manually. Apart from this, Kubernetes not only handles the ability to self-heal, but also provides changes without the need to kill all the containers in our deployment. If something goes wrong, the previous state will be restored and rolled back.
Secret and configuration management
If you would like to use an external configuration or some sort of credentials, without rebuilding containers, then you can use Secrets or ConfigMaps.
Batch Job execution
You can execute a single purpose container as Job. This can be done in parallel, or with just a few in a row, as well as with usage.
Horizontal scaling
As mentioned before, Kubernetes provides its own way of handling autoscaling. It can be based on CPU or Memory utilisation.
Namespaces, labels and annotations
There is no need to create multiple clusters to have separated environment for each stage of our development process. You can use Namespaces, provided by Kubernetes, so every team working over the project will have own virtual cluster. All resources created in namespace exist and are visible only within it, unless you use the name of the chosen namespace as a suffix, along with the name of the resource, to reach it from different namespace(e.g. mynamespace.myresource).
Next are Labels, which can help to distinguish pieces of applications. Apart from that, they are also used by services to run a desired number of container replicas, perform health checking or scheduling. If labels are not enough, then you also have annotations, which can be also used to provide meta-data to resources like names and versions of used libraries or contact information etc.
Dashboard and CLI
You can use the special K8s Dashboard UI to track workloads in your infrastructure, status or even logs – without the . Administrators, on the other hand, will be fond of the command line interface, which allows for the creating and editing of resources, as well as the management of privileges, with simple commands.
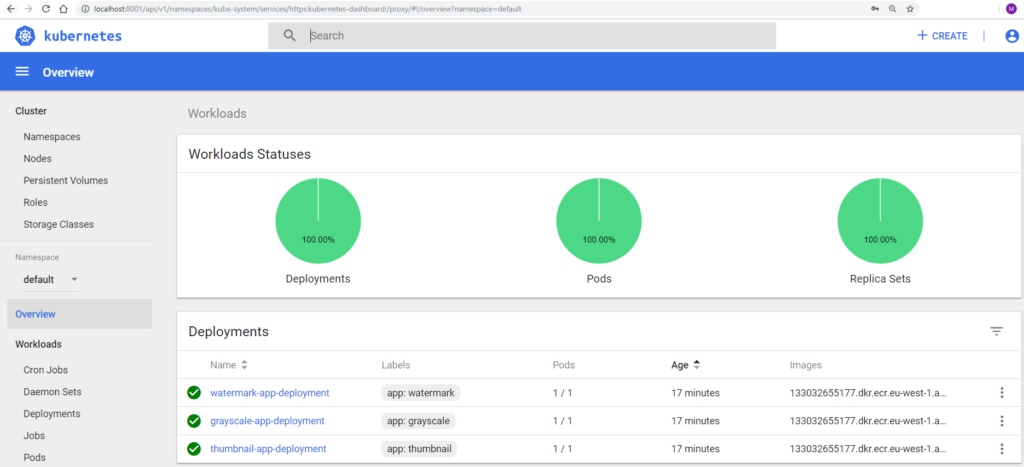
Figure 4 Kubernetes Dashboard
Now it is time to introduce the objects that are commonly used to build infrastructure with Kubernetes. Every single one can be created using manifest file, written in either JSON, YAML or using the command line interface for Kubernetes. With this, it will be easier to understand how various features work and cooperate.
The very first and basic are Pods. These can be considered as wrappers for containers - or even multiple containers. Every Pod has an own IP address assigned and can have attached storage resources, as well.
Next, we have Deployment. It is an object that keeps a desired state among all the Pods declared within. You can perform rolling updates or even pause the process of providing changes if it occurs that something went wrong. It is also possible to declare in the manifest what percentage of deployment has to be available at a time during updates, as well as the rules that should be used for choosing how to handle scheduling.
Alongside this, we have NodeAffinity, which helps us to determine the nodes we prefer to handle our pods. PodAffinity & PodAntiAffinity, however seem to be even more interesting. Using one of these, you can declare that Pod X should or should not be scheduled on node that is already running Pod Y. For a real life use case, it helps to ensure that given collections are located together in case of . For using anti-affinity, we would like to ensure that the declared resources will never be co-located. These configurations are really helpful if you need more advanced options and greater control than the simple NodeSelector, which is limited to choosing the Node by key-value pairs coming from Labels.
Next are HorizontalPodsAutoscalers. These are Kubernetes resources that handle the scaling up or down our Deployment, using data about Memory/CPU Utilisation. It is important to be aware of the formula that is used for running the appropriate number of replicas:
desiredReplicas = ceil[currentReplicas * ( currentMetricValue / desiredMetricValue )]
It works very well and I haven’t noticed any problems with efficiency. By default, information about resources utilisation is fetched every 30 seconds but this can extended or shortened by changing one of kube-controller-manager flags.
Services takes care of sending traffic between Pods or exposing . However, depending on your needs, it is important to note that there are a few types which can be used to create a Service that meets your requirements:
- ClusterIP Assigns the IP address to our deployment, which is accessible only by objects within a cluster.
- NodePort Apart from assigning CusterIP, it also provides the port range (30000-32767) on every node, so it is possible to reach application from outside.
- LoadBalancer You can use even AWS Load Balancers that will cooperate with Kubernetes networking.
ReplicaSet ensures that a declared number of Pods are working at the same time and take care that, if something in our infrastructure will change, a Pod will fail or a node will disappear, then ReplicaSet tries to recreate missing ones to match a required number. It is good to know that this resource is also created along with Deployment.
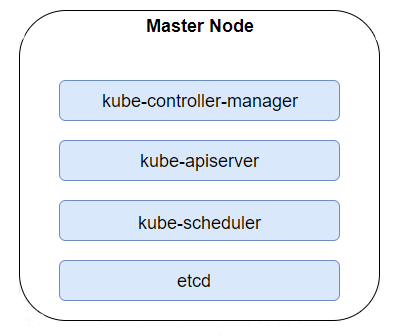
Master Nodes have all the binaries needed to manage infrastructure. The Kube-controller-manager is a daemon that tracks and regulates a cluster’s state using the core control loops shipped with Kubernetes. It uses Kube-apiserver to collect shared data about resources and makes any changes required to achieve the desired state. The second binary is Kube-apiserver, which is a Restful service handling all the requests of an administrator, as well as those that comes from internal communication between Nodes and Pods. Apart from this, we have Kube-scheduler, which takes care of scheduling Resources in the most efficient way, considering storage capacity, cpu/memory utilisation and Labels. The last node worth mentioning is ETCD, which is a highly-available key value store containing information about a cluster’s state.
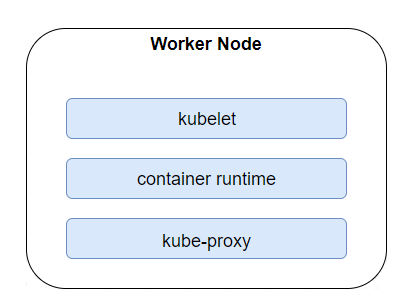
Worker Nodes carry all of our deployed Pods. Similar to Master Nodes, they can be physical machines, Cloud provided virtual machines (VMs) or just VMs on our local server. Apart from containerised resources that have been deployed in each cluster, we can also find binaries dedicated for Workers. Kubelet makes sure that each container is running inside a Pod, for instance, while Kube-proxy maintains networking and forwards connections. To run containers, Kubernetes needs to have a container runtime provided. Among the supported options, the most popular are Containerd and, of course, Docker.
DaemonSets create a copy of a chosen Pod on each Node and make sure that it is always present and working.
Secrets and ConfigMaps are used to keep the configuration away from images and applications. Both can be mounted as volume or attached as an environment variables. The former can keep credentials to the database or registry, as values are provided in Base64 message digest. For the latter ConfigMaps, we can consider them to be a collection of properties that can be injected into a container.
Apart from all the aforementioned features, it is also worth knowing that Borg – Googles internal orchestration project - is the predecessor of Kubernetes. Many of the developers that are responsible for K8s were formally working over Borg. There are four inherited key features
- Pods
- Labels
- Services
- IP per Pod
Amazon Elastic Container Service for Kubernetes
As Kubernetes appeared in the IT market and began to gain popularity, it was only a matter of time before Amazon created a proper service supporting it. In short, this is how the Amazon Elastic Container Service for Kubernetes was born. And for us, that’s great as, with just a few steps, we get a ready cluster containing three Master Nodes, one per nearest Availability Zone by default. For costs, you pay $0.20 per hour, no matter if any of the Masters and have to be recreated, as well as the price of every other Amazon service used in our infrastructure.
At this point, you may be wondering about Worker Nodes. This is up to the administrator to attach EC2 instances, either manually or by Autoscaling Group. There is an appropriate system image in the Amazon Machine Images registry which helps the VM in serving as a Worker.
EKS has quiet frequent updates, so you are able to use all the newest features and be sure that the infrastructure is safe from security breaches. To keep it in the latest version doesn’t take much effort – all you have to do is sign into AWS Management Console, choose the appropriate cluster and version to update it to. It’s as simple as it sounds. Apart from choosing how to handle Worker Nodes, the user is also responsible for installing services, e.g. supporting autoscalling, as by default instances are deprived of any kind of workloads. This can be considered as an advantage or drawback, depending on the individual use case.
However, the biggest problems encountered involed a lack of access to Master Nodes and binaries. Running the Kube-controller-manager is associated with setting flags used by Metrics Server. By default, intervals between checks on the utilisation took 30 seconds and, for scaling down Pods, it can even take up to 5 minutes. In our case, where the peak was having 10,000 images in the queue, these values were not satisfying and, in some scenarios, it occurred that containers were scaling up, even if SQS queues were empty.
AWS Architecture
Now, let's take a closer look at the resources that have been provisioned within the Virtual Private Cloud (VPC) to fit our scenario with Elastic Container Services for Kubernetes.
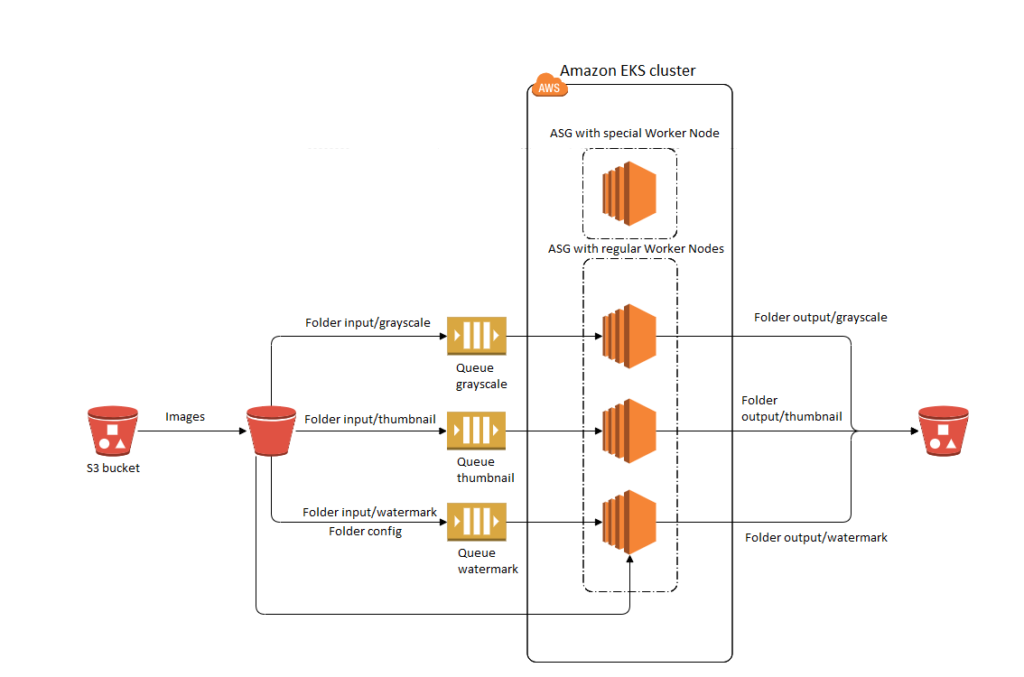
This might be quite confusing at first, as there are no Master Nodes visible in the diagram above but, as mentioned, Amazon takes care of them, preventing any situation where we have a cluster without any single API Service to call. For the rest, we have two different Autoscaling groups for Worker Nodes. Usually, you would undoubtedly consider such infrastructure as anti-pattern, but for our particular scenario and the need to deal with a large number of images in the shortest amount of time, where heavy loads may occur (imagine peak activity, or when a successful promotion or discount results in thousands of users being active over a few seconds), this was pretty satisfying and solved the problem without losing data about resources usage metrics.
If the Worker Node instance with Metrics Server used to scale Pods would be terminated, then there will be no information needed to run the most optimal number of converting apps for around 1 minute in a worst case scenario – which feels bad for applications that can run out of resources. By the time this PoC was being created, we could not find any advice about synchronisation and sharing data between multiple metric-server instances, as this would solve our problem, so we followed a more natural method of creating a cluster with one Autoscaling group for Worker Nodes.
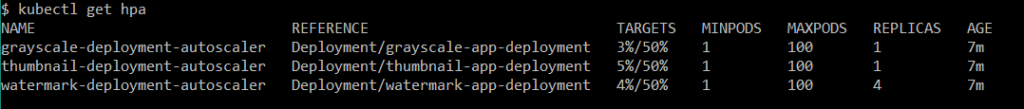
Figure 8 HorizontalPodAutoscalers information from CLI.
Now I’ve explained our approach, below you have the view on workers in a cold state without any traffic. What is important here, however, is that we used the label ROLE to distinguish instances and tell Kubernetes where to deploy Pods containing applications and where to put the ones responsible for handling utilisation data.
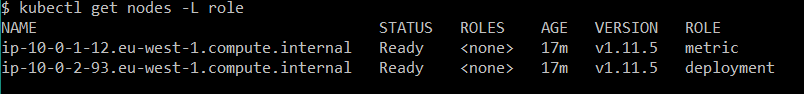
Figure 9 Worker Nodes present in cluster.
Here, you can see the basic setup of our cluster in the required Pods configuration and assignment.
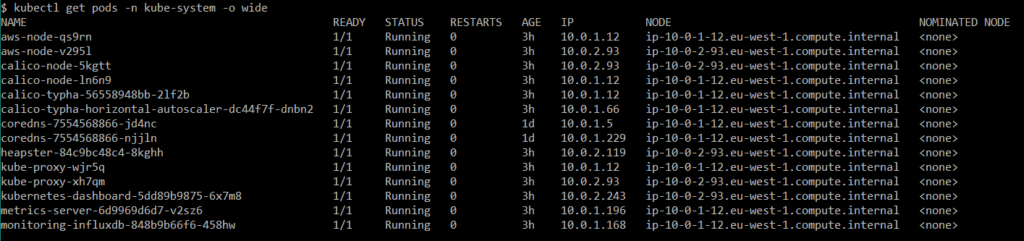
Figure 10 Pods from kube-system namespace.
Apart from aws-node and kube-proxy, as well as calico Pods, I can say that the rest was more or less involved in handling autoscaling, monitoring properly and this is the reason for deploying them on Worker with a label Role that that has the metric value. Fortunately, K8s documentation is easy to understand and contains all the needed information to set up a Metrics Server and Heapster for Dashboard.
Converting Greyscale images
Now, let’s take a look at one of the deployment files containing a manifest for application converting a grayscale copy of the image.
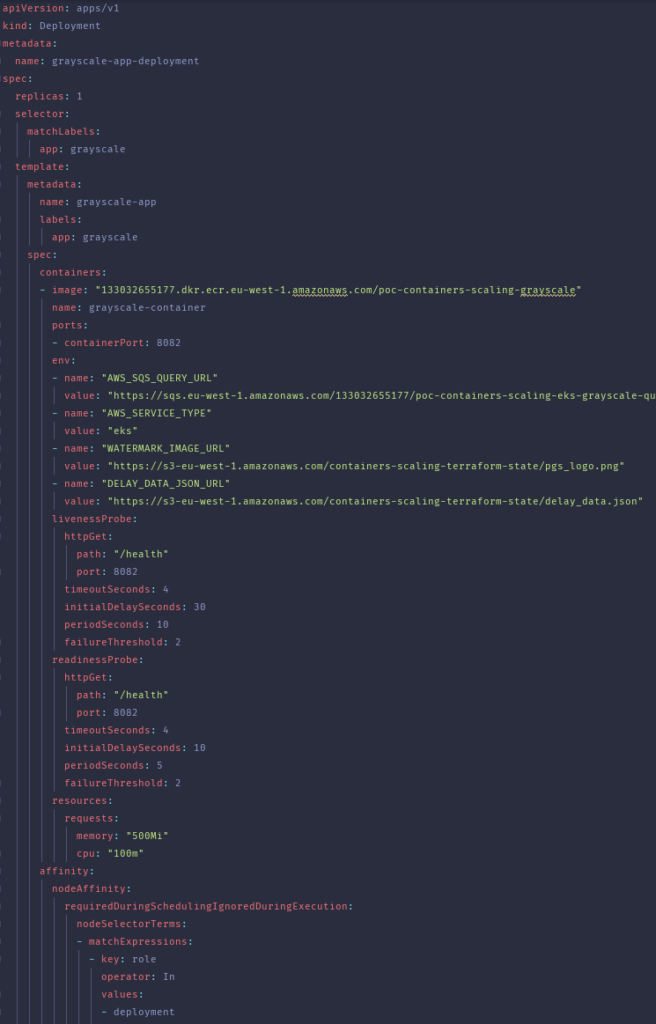
Files were created using terraform templates, as some important values depend on result of setting up infrastructure. As you may know, if applying terraform plan was successful then you can obtain data about created resources via Terraform Output Values. The beginning of each file is very basic and common for every k8s deployment. For more interesting aspects, we have used environment variables to pass important information to our applications to not hardcode them.
Apart from that, it’s worth nothing that LivenessProbes were very important here. During heavy loads, they helped to determine if something was wrong with the container and if it could not handle traffic anymore. In this situation, if the failureThreshold was satisfied, the unhealthy container was recreated. Similarly, to deploy a Pod on the right node, we decided to use NodeAffinity, but a similar result could also be achieved using just NodeSelector with even less effort in writing the file template.
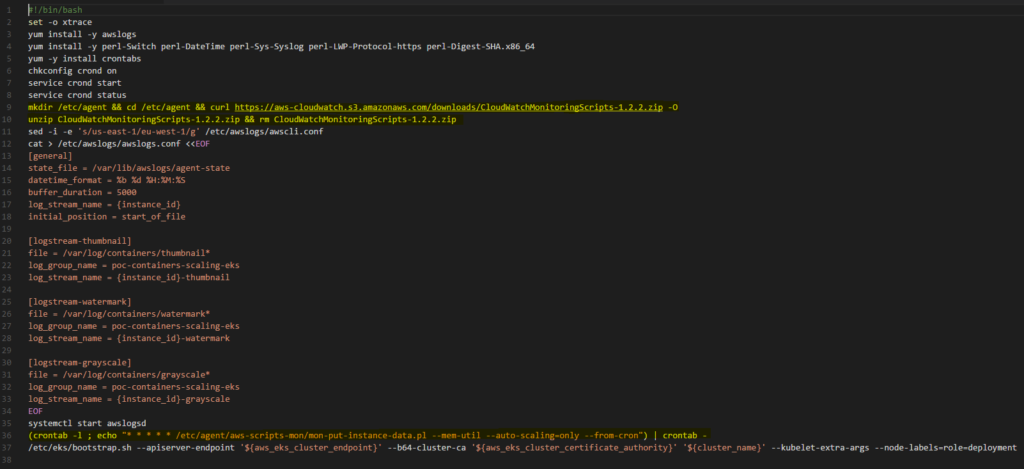
For scaling Workers, there was no support for Cloud Watch utilisation alarms for EKS when this was carried out. One of idea we had was to create an AWS Lambda to scale Workers, based on the number of Images in the SQS queue but, finally, we decided to add a section installing the CloudWatch agent to the bash script, which is applied during the initialisation of every Worker EC2 instance in our infrastructure. Now, it should be much clearer why our test scenarios were different than these for ECS or Fargate. Agents installed on our instances also sent collected data every minute, as configured using Crontab.
Test Scenarios
In order to test the EKS cluster scaling, as described above, 10,000 images were uploaded to the appropriate folders in the S3 bucket. These test cases were divided in two groups: INSTANCE/MEMORY - POD/CPU and INSTANCE/CPU - POD/CPU. For scaling instances, we have used CloudWatch alarms and also agents that were installed on every single Worker during initialization.
For Pods, on the other hand, we created HorizotalPodAutoscalers. During the very first phase of tests, we discovered that scaling pods based on memory is effortless, because in our case as images were not converted in parallel. Each group has predefined settings for Cloud Watch alarms that are common to its respective scenarios.
We did not included testing different AutoScalingGroup thresholds, as this proof of concept would be too broad and the results would be hard to process. So, let's get to the actual scenarios:
INSTANCE/MEMORY - POD/CPU
- 100% of images were uploaded to the input/watermark folder. Scale up policy for EKS Worker instances set to above 65% in Cloud Watch alarm. Scale down policy for EKS Worker instances set to below 45% in Cloud Watch alarm. Scale up metrics for Pods set to above 70% in HorizontalPodAutoscaler.
- 40% of images were uploaded to the input/grayscale folder. 40% of images were uploaded to the input/thumbnail folder. 20% of images were uploaded to the input/watermark folder. Scale up policy for EKS Worker instances set to above 65% in Cloud Watch alarm. Scale down policy for EKS Worker instances set to below 45% in Cloud Watch alarm. Scale up metrics for Pods set to above 70% in HorizontalPodAutoscaler.
- 40% of images were uploaded to the input/grayscale folder. 40% of images were uploaded to the input/thumbnail folder. 20% of images were uploaded to the input/watermark folder. Scale up policy for EKS Worker instances set to above 65% in Cloud Watch alarm. Scale down policy for EKS Worker instances set to below 45% in Cloud Watch alarm. Scale up metrics for Pods set to above 50% in HorizontalPodAutoscaler.
- 40% of images were uploaded to the input/grayscale folder. 40% of images were uploaded to the input/thumbnail folder. 20% of images were uploaded to the input/watermark folder. Scale up policy for EKS Worker instances set to above 65% in Cloud Watch alarm. Scale down policy for EKS Worker instances set to below 45% in Cloud Watch alarm. Scale up metrics for Pods set to above 30% in HorizontalPodAutoscaler.
The table below presents the test results for the first group, such as the duration of image processing, the duration of Pods scaling up for each Deployment, and the number of EKS Worker instances scaling up.
| Duration [s] Test Case | Image processing duration [s] | Grayscale Pods/Processing time [s] | Thumbnail Pods/Processing time [s] | Watermark Pods/Processing time [s] | EKS Worker instances scale up duration between alarms [s] | EKS Worker instance max number |
|---|---|---|---|---|---|---|
| 1 | 550 | - | - | 16/550 | 21-121 | 4 |
| 2 | 670 | 8/372 | 4/653 | 4/283 | 20-185 | 4 |
| 3 | 754 | 16/573 | 7/748 | 4/257 | 37-152 | 5* |
| 4 | 650 | 16/342 | 8/646 | 8/344 | 49-15 | 5* |
* Last instance added at the end or after processing
As shown in the table, a change in the HorizontalPodAutoscaler threshold had a noticeable impact on test results. We expected that, after a decrease in the alarm threshold, the image processing time would be lower than that encountered with the larger threshold. Comparing cases 1 and 3, where the threshold for test case 3 is 20% lower, image processing time increased for almost 200 seconds in general.
We can also notice that, for cases 3 and 4, where thresholds were adequately 50% and 30%, a problem occurred with creating additional Worker instances after image processing had finished. This situation is possibly associated with the default time for fetching Pod’s utilisation data. Setting the threshold equal to or below 50 gives Kubernetes the signal to add couple of containers, even if processing is over or the need for additional pods is exaggerated.
It is also worth mentioning that, for Grayscale deployment, Autoscaler created 16 replicas in scenario 3 and 4. This is about two times more than for Watermark and Thumbnail. During an initial assessment of the dashboard, we noticed that all applications have similar resources requests, so this disproportion would need a deeper investigation. The most optimal among test scenarios from this group seems to be setting the configuration similar to the second scenario - but I would suggest to try setting the scale up policy for the Cloud Watch alarm to about 75-80%, as 4 instances for 16 pods is a bit too much and it unnecessarily increases costs.
INSTANCE/CPU - POD/CPU
- 100% of images were uploaded to the input/watermark folder. Scale up policy for EKS Worker instances set to above 50% in the Cloud Watch alarm. Scale down policy for EKS Worker instances set to below 30% in the Cloud Watch alarm. Scale up metrics for Pods set to above 70% in HorizontalPodAutoscaler.
- 40% of images were uploaded to the input/grayscale folder. 40% of images were uploaded to the input/thumbnail folder. 20% of images were uploaded to the input/watermark folder. Scale up policy for EKS Worker instances set to above 50% in the Cloud Watch alarm. Scale down policy for EKS Worker instances set to below 30% in the Cloud Watch alarm. Scale up metrics for Pods set to above 70% in HorizontalPodAutoscaler.
- 40% of images were uploaded to the input/grayscale folder. 40% of images were uploaded to the input/thumbnail folder. 20% of images were uploaded to the input/watermark folder. Scale up policy for EKS Worker instances set to above 50% in the Cloud Watch alarm. Scale down policy for EKS Worker instances set to below 30% in the Cloud Watch alarm. Scale up metrics for Pods set to above 50% in HorizontalPodAutoscaler.
- 40% of images were uploaded to the input/grayscale folder. 40% of images were uploaded to the input/thumbnail folder. 20% of images were uploaded to the input/watermark folder. Scale up policy for EKS Worker instances set to above 50% in the Cloud Watch alarm. Scale down policy for EKS Worker instances set to below 30% in the Cloud Watch alarm. Scale up metrics for Pods set to above 30% in HorizontalPodAutoscaler.
The table below presents the test results for the second group.
| Duration [s] Test Case | Image processing duration [s] | Grayscale Pods/Processing time [s] | Thumbnail Pods/Processing time [s] | Watermark Pods/Processing time [s] | EKS Worker instances scale up duration between alarms [s] | EKS Worker instance max number |
|---|---|---|---|---|---|---|
| 1 | 1040 | - | - | (12-18)*/1040 | 23-180 | 3** |
| 2 | 623 | 8/506 | 6/377 | 6/228 | 20-145 | 4 |
| 3 | 530 | 8/462 | 6/439 | 8/520 | 53-180 | 5 |
| 4 | 556 | (26-32)*/429 | 8/347 | 6/507 | 54-161 | 6* |
* Last instance added at the end or after processing ** Problem with scaling optimisation
As shown in the table, for the second group of results, the prepared test cases for scaling Worker instances (based on CPU) seems to be more problematic and, in general, the infrastructure looks deregulated. For scenario 1 and 4, there were even problems with starting the desired number of Pods. For the former, there 12 running, even though 18 were originally desired and, for the latter, 26 ran, as opposed to the 32 demanded.
Moreover, these 32 instances were not needed at all and whole the Grayscale deployment scaled from 16 to 26 after the images were processed. For scenario 1, the processing was quiet slow and Worker scaling management did not work well.
Among all these configurations, I would suggest using the one from test scenario number 3 but as for previous summary, some additional tests are welcome.
Summary
In conclusion, Amazon EKS provides a quick method for creating reliable clusters and an easy way to manage infrastructure without going into Kubernetes documentation. Creating a cluster, however, is not the end of our work. Making all the components work together took some time and also required a deeper knowledge about k8s.
Another problem that you might face using a kubernetes solution is creating good architecture. For me, personally, this PoC was the first attempt in creating an answer for a specific, given business scenario. I am open to any suggestions or comments, as sharing knowledge and thoughts is always a highly important part of technology development.
From the perspective of the photography company, the most important factors are time to market and eliminating the administrative overhead, so the best option is to use AWS Fargate. Using EKS requires hiring someone that knows not only AWS Cloud, but also Kubernetes itself. Of course, if you have someone like that already, then AWS EKS would for sure be worth reconsideration, as the processing time was the best almost in every scenario. If changes in the architecture of the application would come into play, we would strongly recommend using a serverless architecture with AWS services and Lambdas.
Business Perspective
There's more than one way to achieve any solution. Based on your exact business goals and parameters, such as cost and efficiency, it helps to have a knowledge of all available options to better pick the most efficient.
Written by
Xebia Author


Contact