
Knowing when to act is an important aspect of Observability. You might have a lot of individual metrics, some of which indicate an error rate for example. You may be inclined to set an alert for those error rates, and immediately have someone investigate them whenever they increase or aren’t zero. But a single error could occur because of any number of reasons, many of which are not easily identifiable, or even noticeable by end-users. What if I told you, you don’t have to act on each one?
Learning from SRE, the theory
Regardless of whether or not you practice SRE, it provides a helpful structure for categorizing metrics, namely Service Level Indicators (SLIs), Service Level Objectives (SLOs) and Service Level Agreements (SLAs). These can be used to objectively indicate when to act.
Service Level Indicators (SLIs)
- Are individual metrics, queries, log events, anything you’re probably already collecting.
- For example: amount of completed orders, transactions, or just plain 5xx errors.
- Are used to calculate whether your SLOs are met.
Service Level Objectives (SLOs)
- Are your reliability target. For example, if you have a webshop where users may be able to view the details of a product: 99.5% of all product details views should be successful.
- Are set as a team or organization, but measured from the perspective of the end user. This is all about perception. An end-user should theoretically be able to measure this themselves and come to the same number.
- Are about a span of time, such as a day, week or month.
- Are measured using SLIs.
Service Level Agreements (SLAs)
- Are a contractual SLO with end users. Usually only applicable in a B2B setting, for example when guaranteeing the availability of a SaaS service.
The theory behind these categories is that the perception of your end-users are the most important metric. If your end-users perceive your service as reliable, they will be happy and more likely to keep using your services. End-users do not notice 100% reliability since any other service in the chain isn’t 100% reliable either. For example, their WiFi connection, internet provider, or phone, could all fail before they notice a failure on your end. They’re likely to try again if they encounter such a failure. However, unreliability becomes much more noticeable as time goes on. 99.9% reliability in a week means only 10 minutes of downtime, but 99% already means nearly two hours.
Whenever you risk not meeting your SLO, this is when you should act, since your end-users will perceive your service as becoming unreliable. If you’ve agreed upon an SLA, this could even result in monetary compensation to your end-users.
However, on the other hand, it also means that if there’s currently no risk of not meeting your SLO, investigating any errors indicated by an SLI can be safely postponed or even ignored. This means your development teams can prioritize other work, and more accurately balance investigating errors and bugfixing between building new features.
In the next section, let’s put all this theory into practice.
SLIs and SLOs in practice
Let’s say there’s a metric counting the amount of errors when a user views a product details page on a webshop:
fetch_product_details_errorsWhen we query this metric (our SLI) in our favourite monitoring tool (for example, Prometheus, ElasticSearch, you name it), we get a number indicating the amount of errors at that time.
We could also query the total amount of product details views and divide the errors by that number for comparison:
fetch_product_details_errors
/
fetch_product_details_count
Now we have the ratio. Let’s build on this and make it a percentage:
(
  1 – (
    fetch_product_details_errors
    /
    fetch_product_details_count
  )
) * 100
This already gives you a basic indication of your reliability at any given time. However, as I mentioned before, SLOs are about a span of time. Let’s calculate this over a week:
(
  1 – (
    sum(rate(fetch_product_details_errors[1w]))
    /
    sum(rate(fetch_product_details_count[1w]))
  )
) * 100
And there we have the metric which indicates whether our SLO is met. As indicated by the sum(rate()[1w]) function, this will give you the totals over one week. The whole query will output a percentage such as 99.9% which you can alert on when it risks dropping below the threshold of your SLO. Note that I’ve used Prometheus syntax in these examples, but this will be roughly similar in other monitoring tools.
What about SLAs?
Should you have a contractual SLA with your end users, you can use the same query as used above for SLOs to calculate whether you’re meeting it. However, take care to set your SLO higher than your SLA so that you get an alert when your SLO isn’t met way ahead of being in breach of your SLA.
For example, if your SLA is 99.5%, set your SLO as 99.9%.
Error Budgets
Taking this a step further, another helpful metric of SRE are error budgets. These indicate the amount of errors in time you have left, before you drop below your SLO:
- Amount of errors you can afford before you drop below your SLO
- Expressed in time, typically hours of unreliability over a period of 7 days
- For example: With SLO “99.5% of all product details views should be successful” you will have an error budget of 0.84 hours over 7 days
- Error budgets may contain multiple SLOs in a single budget (like latency, frontend errors, etc.), as long as it makes sense for a product and team.
- Is your budget spent? You should prioritize increasing reliability, no new features.
The previous example with an SLO of 99.5% needs the following query to calculate your error budget in hours over 7 days:
168 * (
  0.005 – (
    sum(rate(fetch_product_details_errors[1w]))
    /
    sum(rate(fetch_product_details_count[1w]))
  )
)
Since there are 168 hours in a week and your SLO of 99.5% means a ratio of 1 – 0.995 = 0.005.
When expressing this in a graph, it becomes exceptionally clear when you risk dropping below your error budget:
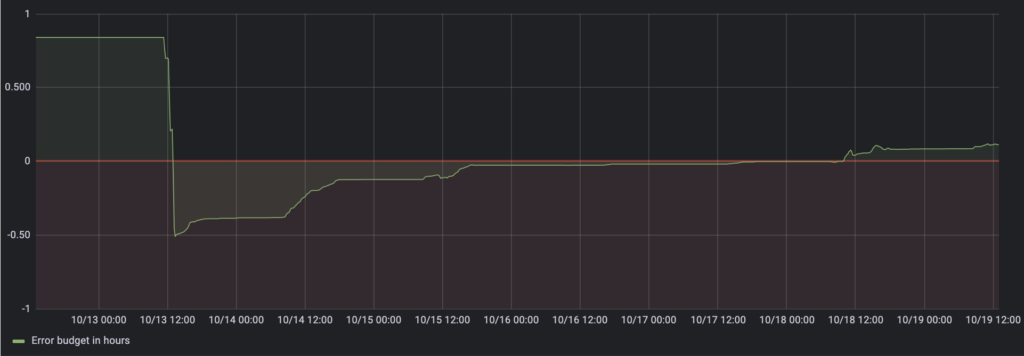
As you can see, the budget is 0.84 hours when there are no errors. When a lot of errors occur, it drops below zero, meaning your budget is spent. You would then fix the problem, and focus on anything else which will improve reliability. As time passes, the error budget rises again, meaning as soon as it climbs above the threshold of zero, you can again focus on new features.
And that's it! A few practical ways to objectively indicate when to act, using SLOs and Error Budgets. Watch this space in the future for other Observability related posts, such as correlating events between metrics, logs and traces to more accurately investigate issues when it's time to act.
Written by
Tariq Ettaji
Software Delivery Consultant
Our Ideas
Explore More Blogs


From Spec to Code: Building Software with Spec Kit
This article walks through the full workflow, from installation to a working implementation, covering both greenfield projects and extending an...
Hidde de Smet, Emanuele Bartolesi


Contact