HBase is a column-oriented DBMS providing fast random access. It comes with a management UI showing table details, but I wanted a better understanding of the internals of HBase. In this blog post I will show how to get started with Prometheus‘ JMX exporter, exporting the HBase metrics and visualizing them in Grafana.
The Setup
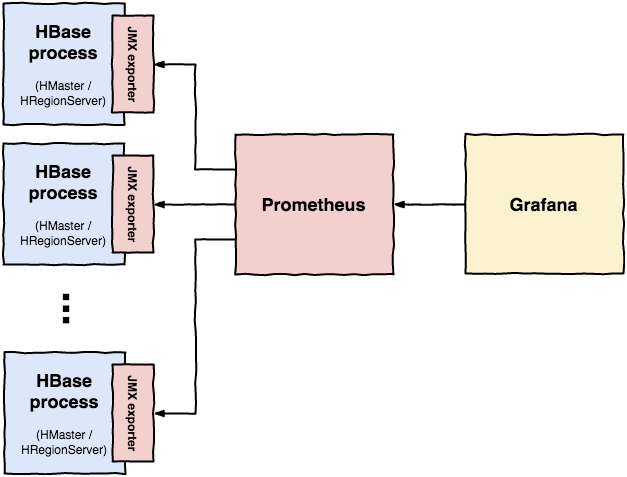
We will monitor HBase using three tools: (1) Prometheus’ JMX exporter for exporting HBase’s JMX metrics, (2) Prometheus for storing metrics and (3) Grafana for visualizing the metrics. I’m running a pseudo-distributed HBase with 2 masters and 4 regionservers in this post.
Prometheus is an open-source time series database system for collecting system metrics. I find it very easy to set up, manage and collect metrics. It uses a pull-model over HTTP to continuously fetch metrics and features several out-of-the-box exporters for several systems. If you’re running a JVM-based application but there’s no dedicated exporter, then the JMX exporter can be used for exposing JMX MBeans in the Prometheus metric format.
JMX, a.k.a. Java Management Extensions, is a set of tools for connecting to a JVM and managing resources at runtime. JMX managed resources are called Managed Beans (MBeans), and these can expose information about HBase’s status for us. Finally, Grafana is an open-source visualization tool which works nicely with several time series databases, such as Prometheus.
The image below shows the setup of the monitoring system.

Exposing HBase Metrics
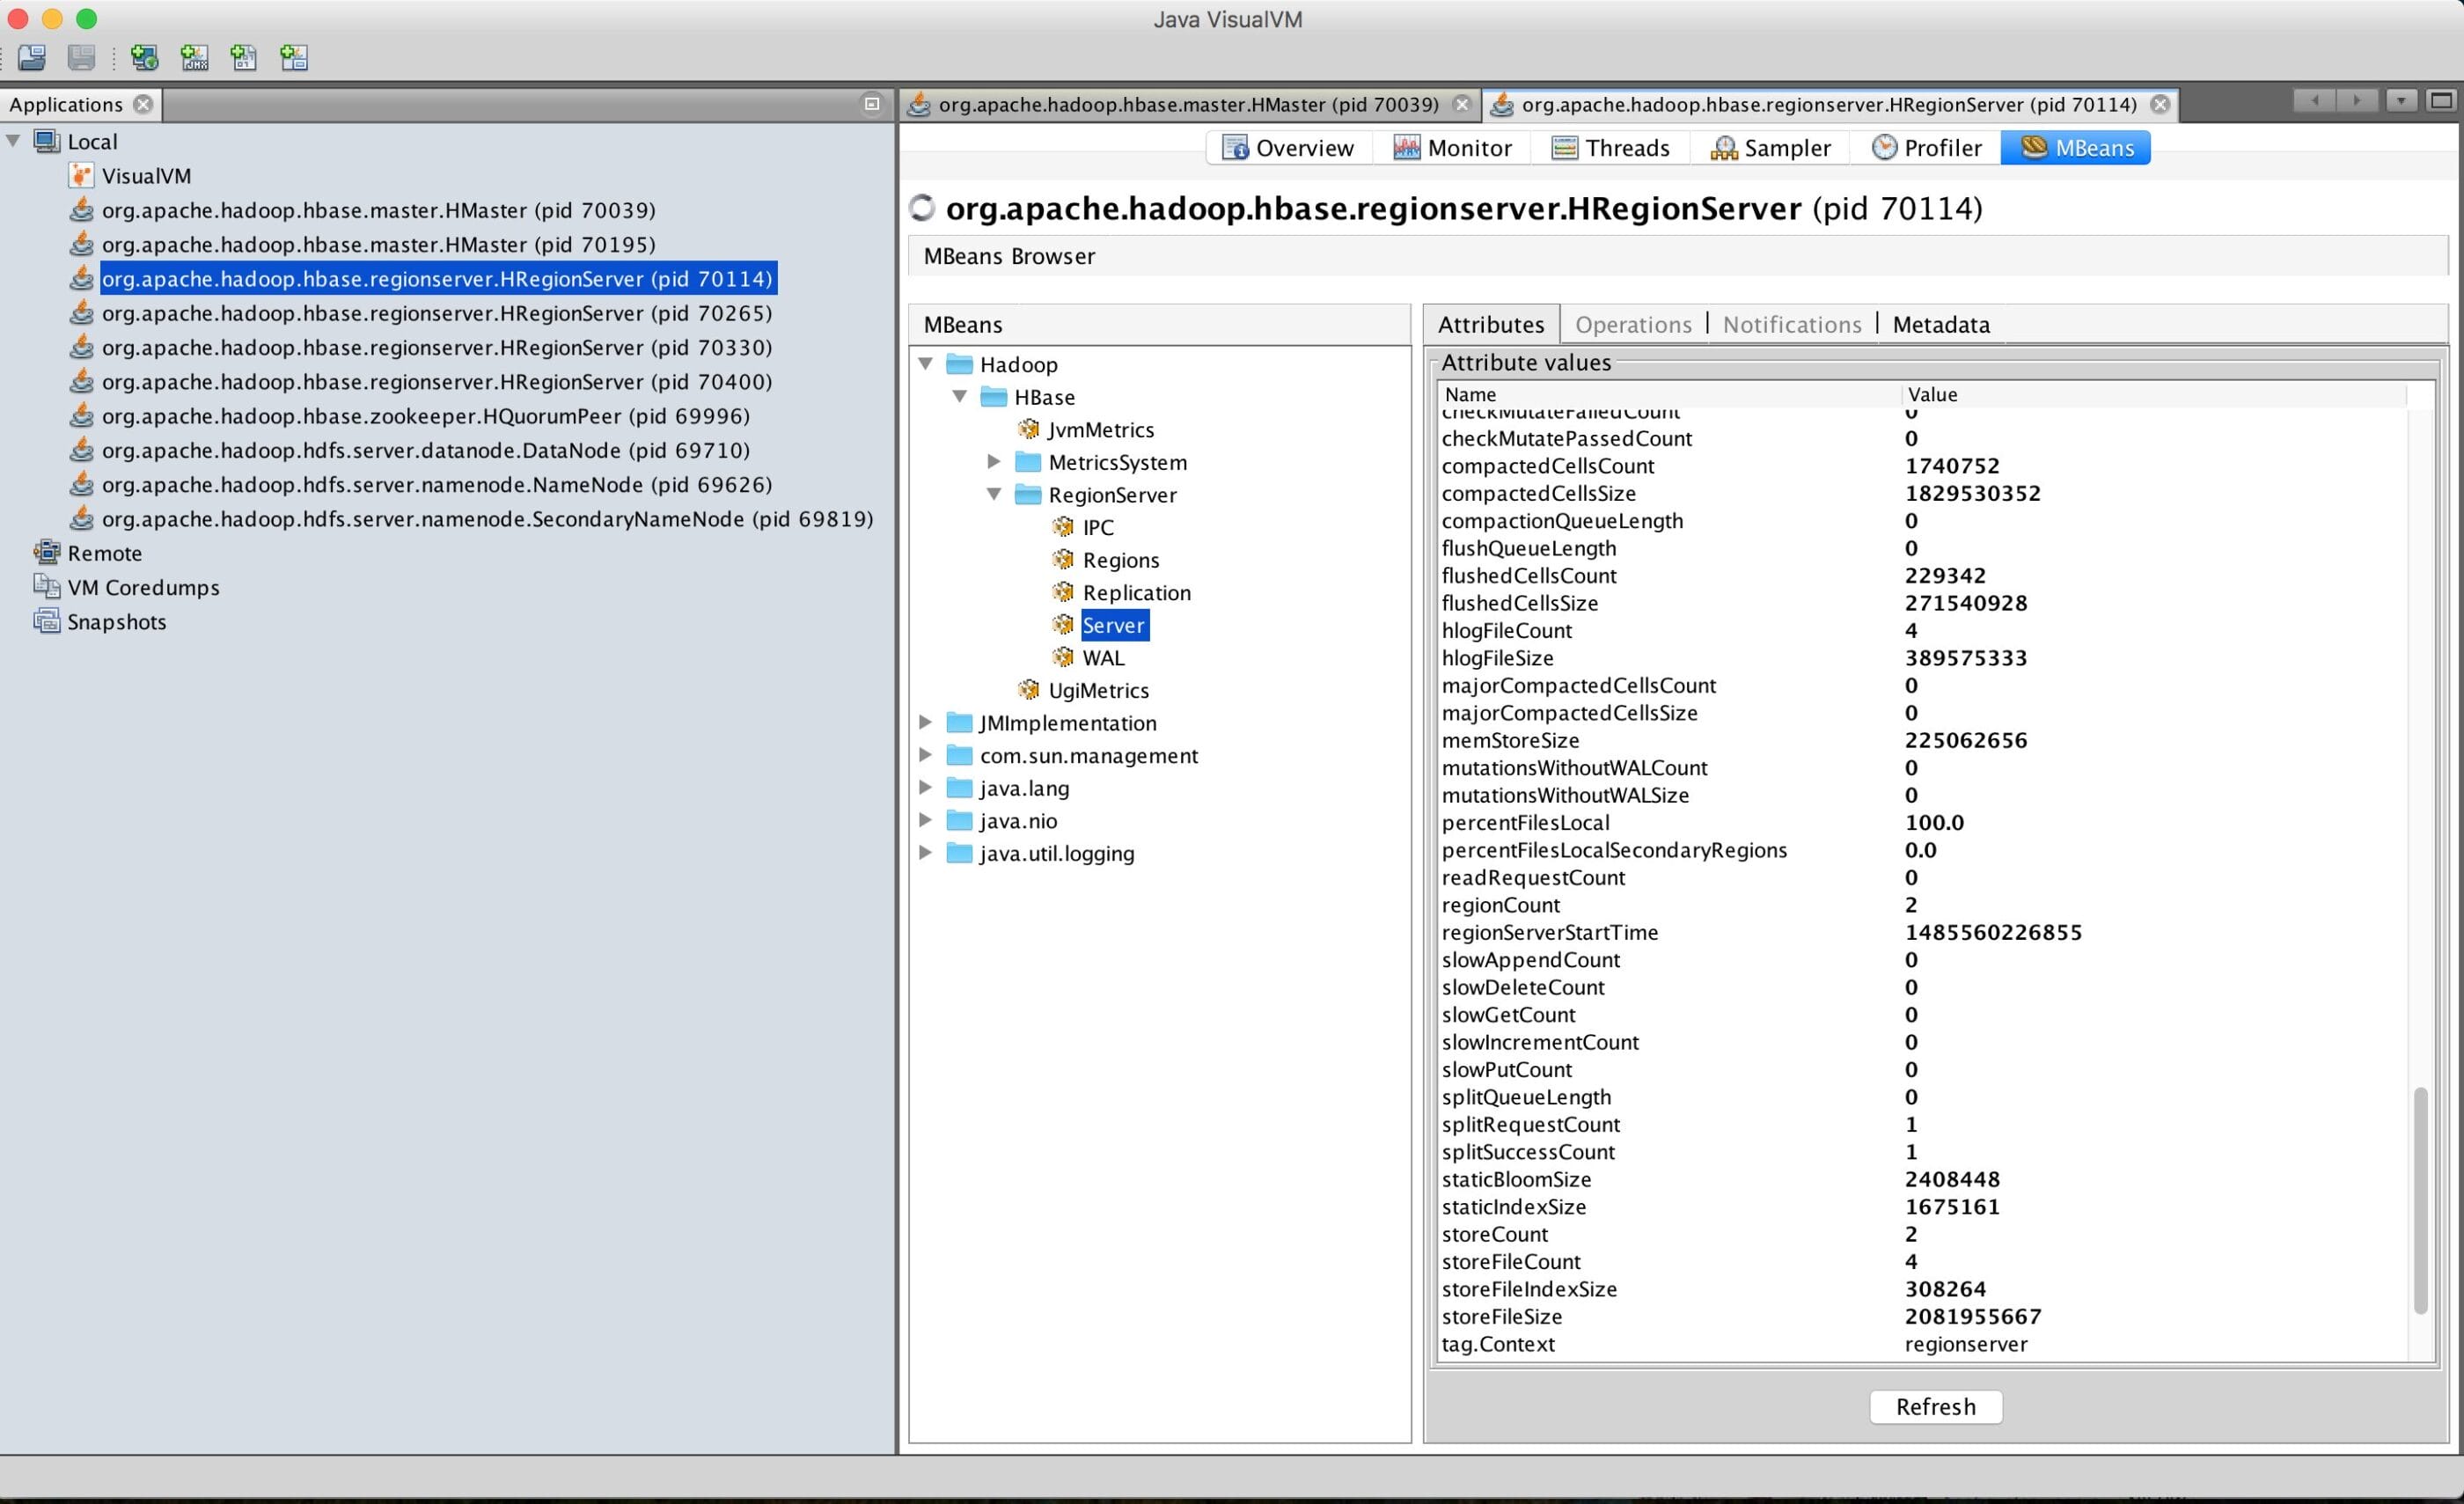
In the HBase UI, you can view the raw JMX metrics in the "Metrics Dump" tab. On the machine itself you can also inspect the HMaster and HRegionServer process with JConsole or JVisualVM. JConsole provides an MBeans tab to directly view the exposed MBeans. With JVisualVM you’ll first have to install the VisualVM-MBeans plugin (Tools –> Plugins). With this running, we can view all sorts of metrics of HBase.

Prometheus however cannot directly read the MBeans. It requires the metrics in its own format so we need to transform the MBeans first. The Prometheus JMX exporter serves exactly this purpose. It can run in two ways: (1) as an independent HTTP server scraping and transforming the JMX metrics or (2) as a Java agent exposing an HTTP server and scraping the JVM. In this post I’ll run the javaagent option. See the JMX exporter GitHub for instructions on running the HTTP server option. A Java agent is like a JVM plugin that utilizes the Java Instrumentation API which allows us to monitor and profile JVMs. Start the JVM with the -javaagent argument:
# javaagent option
$ java -javaagent:[=options] -jar yourjar.jar

# Prometheus JMX javaagent options
$ java -javaagent:jmxexporter.jar=port:/jmxconfig.yaml -jar yourjar.jar
So to hook up the javaagent with HBase, add the following lines to your hbase-env.sh:
HBASE_OPTS="$HBASE_OPTS -javaagent:/path/jmx_prometheus_javaagent-0.7.jar=7000:/path/hbase_jmx_config.yaml"
The config.yaml is mandatory, however it does not need to contain any configuration so an empty yaml file is fine. The exporter jar file can be downloaded from Maven Central. After starting HBase, you should now see the metrics in Prometheus’ metrics format on the specified port, path /metrics:
$ curl localhost:7000/metrics

# HELP jmx_config_reload_failure_total Number of times configuration have failed to be reloaded.
# TYPE jmx_config_reload_failure_total counter
jmx_config_reload_failure_total 0.0
# HELP process_cpu_seconds_total CPU time used by the process in seconds.
# TYPE process_cpu_seconds_total counter
process_cpu_seconds_total 57.72266
# HELP process_start_time_seconds Start time of the process, in unixtime.
# TYPE process_start_time_seconds gauge
process_start_time_seconds 1.485560224181E9
.
.
.
Exposing Metrics in Pseudo-Distributed Mode
Attaching the javaagent to a fixed port will work if each HBase JVM is running on a different host. This fails in pseudo-distributed mode since the port is used after the first HBase JVM is started. To solve this, I added the following to bin/hbase. hbase-env.sh is sourced only once at start-up so I executed this script in bin/hbase just before spinning up the JVMs. It checks for the first available port in the range 7000-7010.
if [ "$COMMAND" = "master" ] || [ "$COMMAND" = "regionserver" ]; then
  for port in {7000..7010}; do
    if [ </span>lsof -n -i:$port <span class="p">|</span> grep LISTEN <span class="p">|</span> wc -l<span class="sb"> == "1" ]; then
      echo "Checking port $port - port $port in use"
    else
      echo "Checking port $port - port $port not in use - using port $port"
      HBASE_OPTS="$HBASE_OPTS -javaagent:/path/jmx_prometheus_javaagent-0.7.jar=$port:/path/hbase_jmx_config.yaml"
      break
    fi
  done
fi
Visualizing The Metrics
Set up Prometheus and Grafana and add the exposed metrics to your Prometheus’ targets file:
global:
  scrape_interval: 15s
  evaluation_interval: 15s

scrape_configs:
  - job_name: 'hbase'
    static_configs:
      - targets: ['localhost:7000', 'localhost:7001', 'localhost:7002', 'localhost:7003', 'localhost:7004', 'localhost:7005']
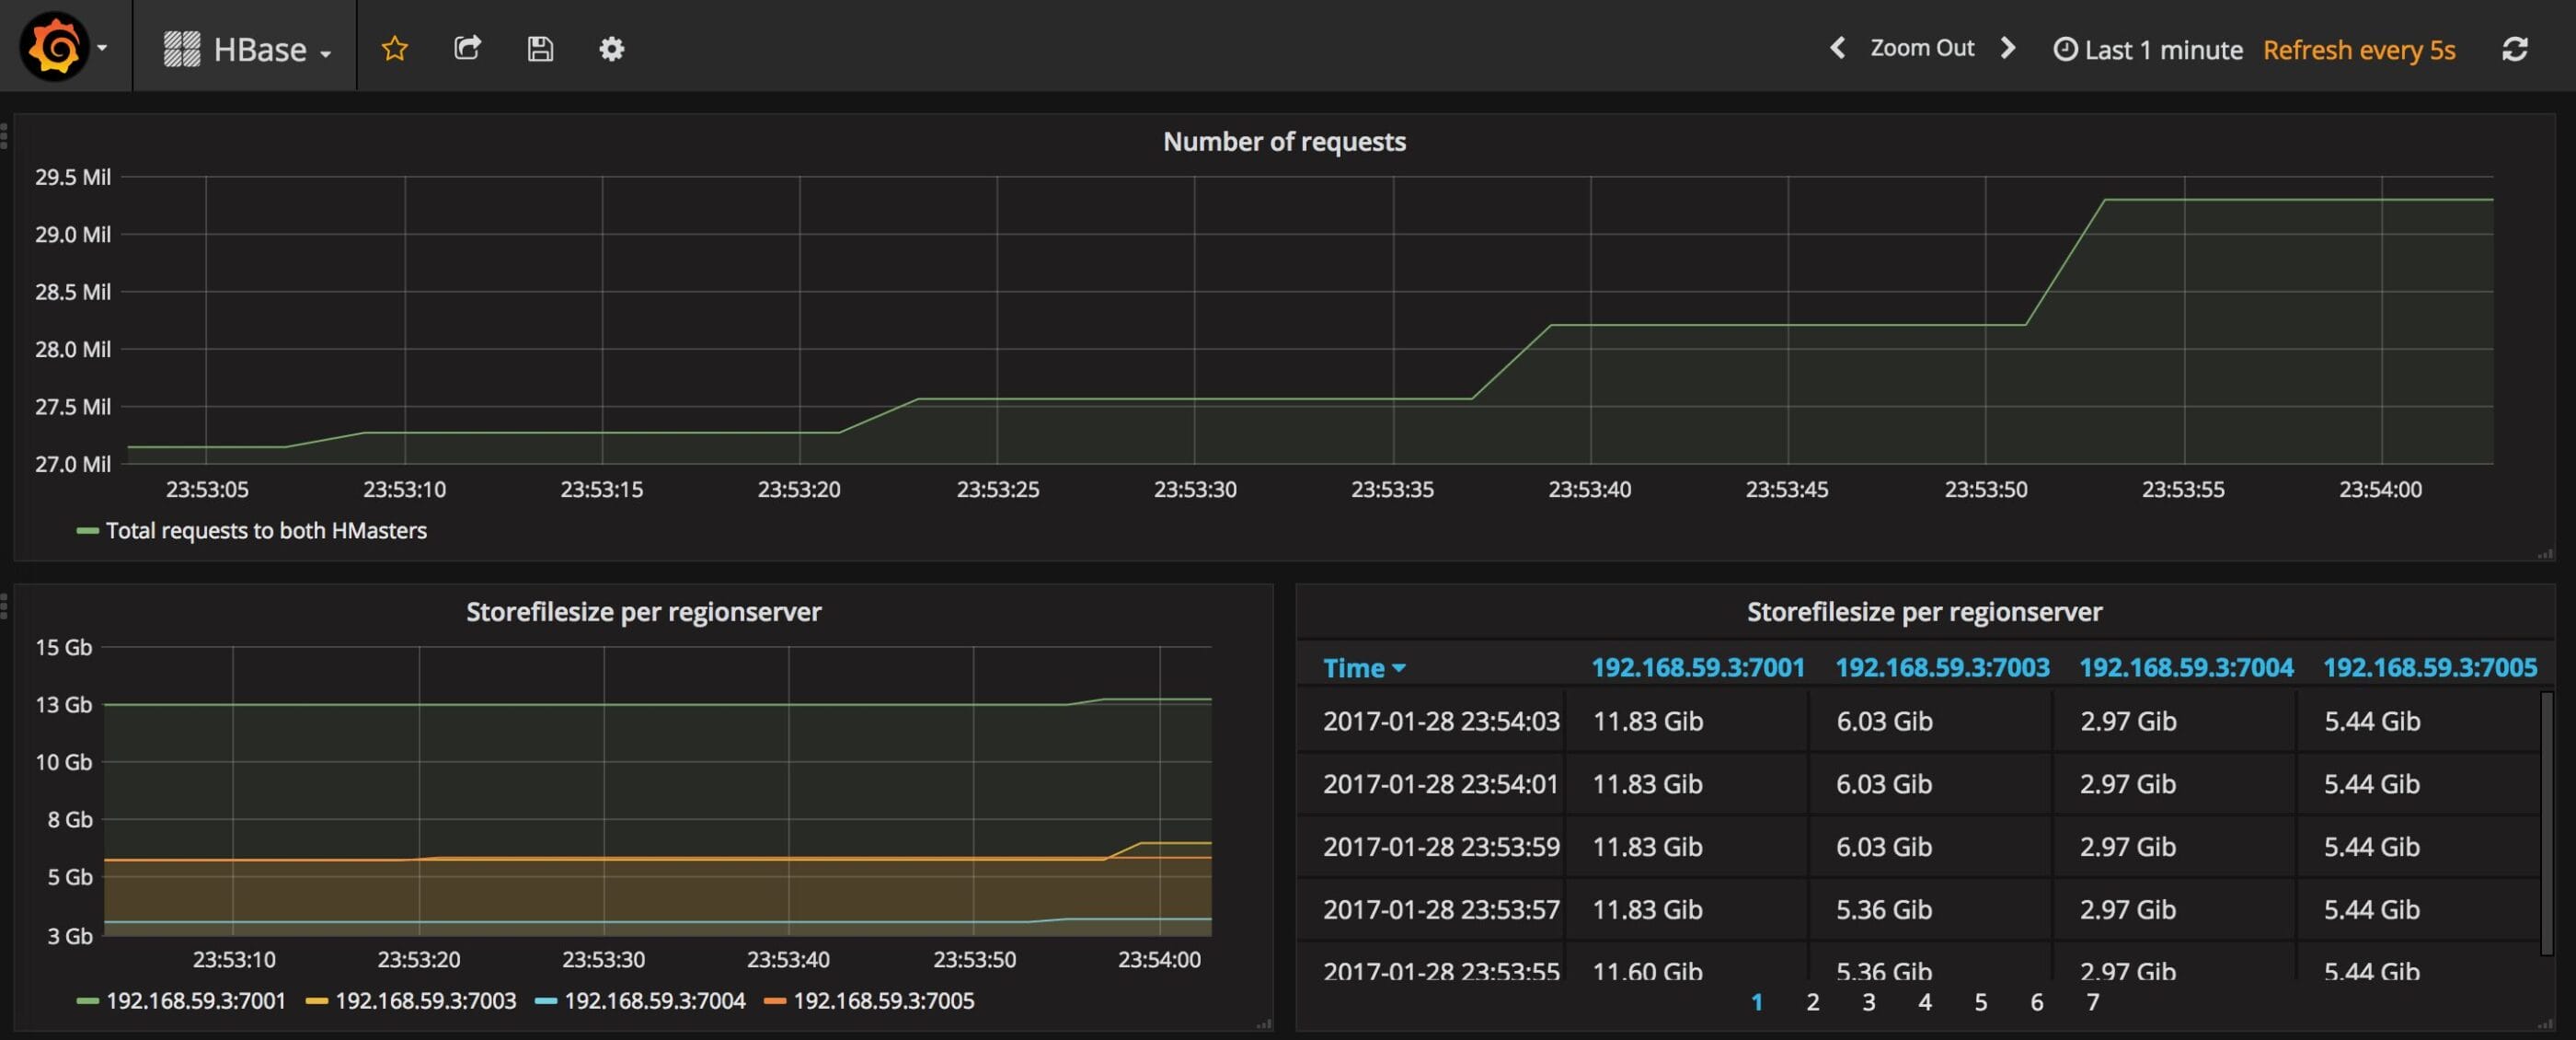
In Prometheus you are now able to query. The metrics are named Hadoop<em>HBase</em>[attributename]. Add the Prometheus datasource in Grafana and we can now visualize and create a dashboard:

Configuring The JMX Exporter
The Prometheus metrics format is metric_name{label_name="label_value"} value [timestamp]. The JMX exporter does a decent job converting the MBeans to Prometheus metrics without configuration. However some metrics are not exposed correctly, e.g. in the regionserver metrics there’s a metric Hadoop_HBase_Namespace_default_table_TestTable_region_5c54bd5d2a312fd17b6d226b4ce88370_metric_storeCount {name="RegionServer",sub="Regions",}. The region id is in the metric name and you probably want this value as a label so you can aggregate on it in Prometheus. To configure this correctly, edit the config.yaml:
rules:
  - pattern: HadoopNamespace_([^W_]+)_table_([^W_]+)_region_([^W_]+)_metric_(w+)
    name: HBase_metric_$4
    labels:
      namespace: "$1"
      table: "$2"
      region: "$3"
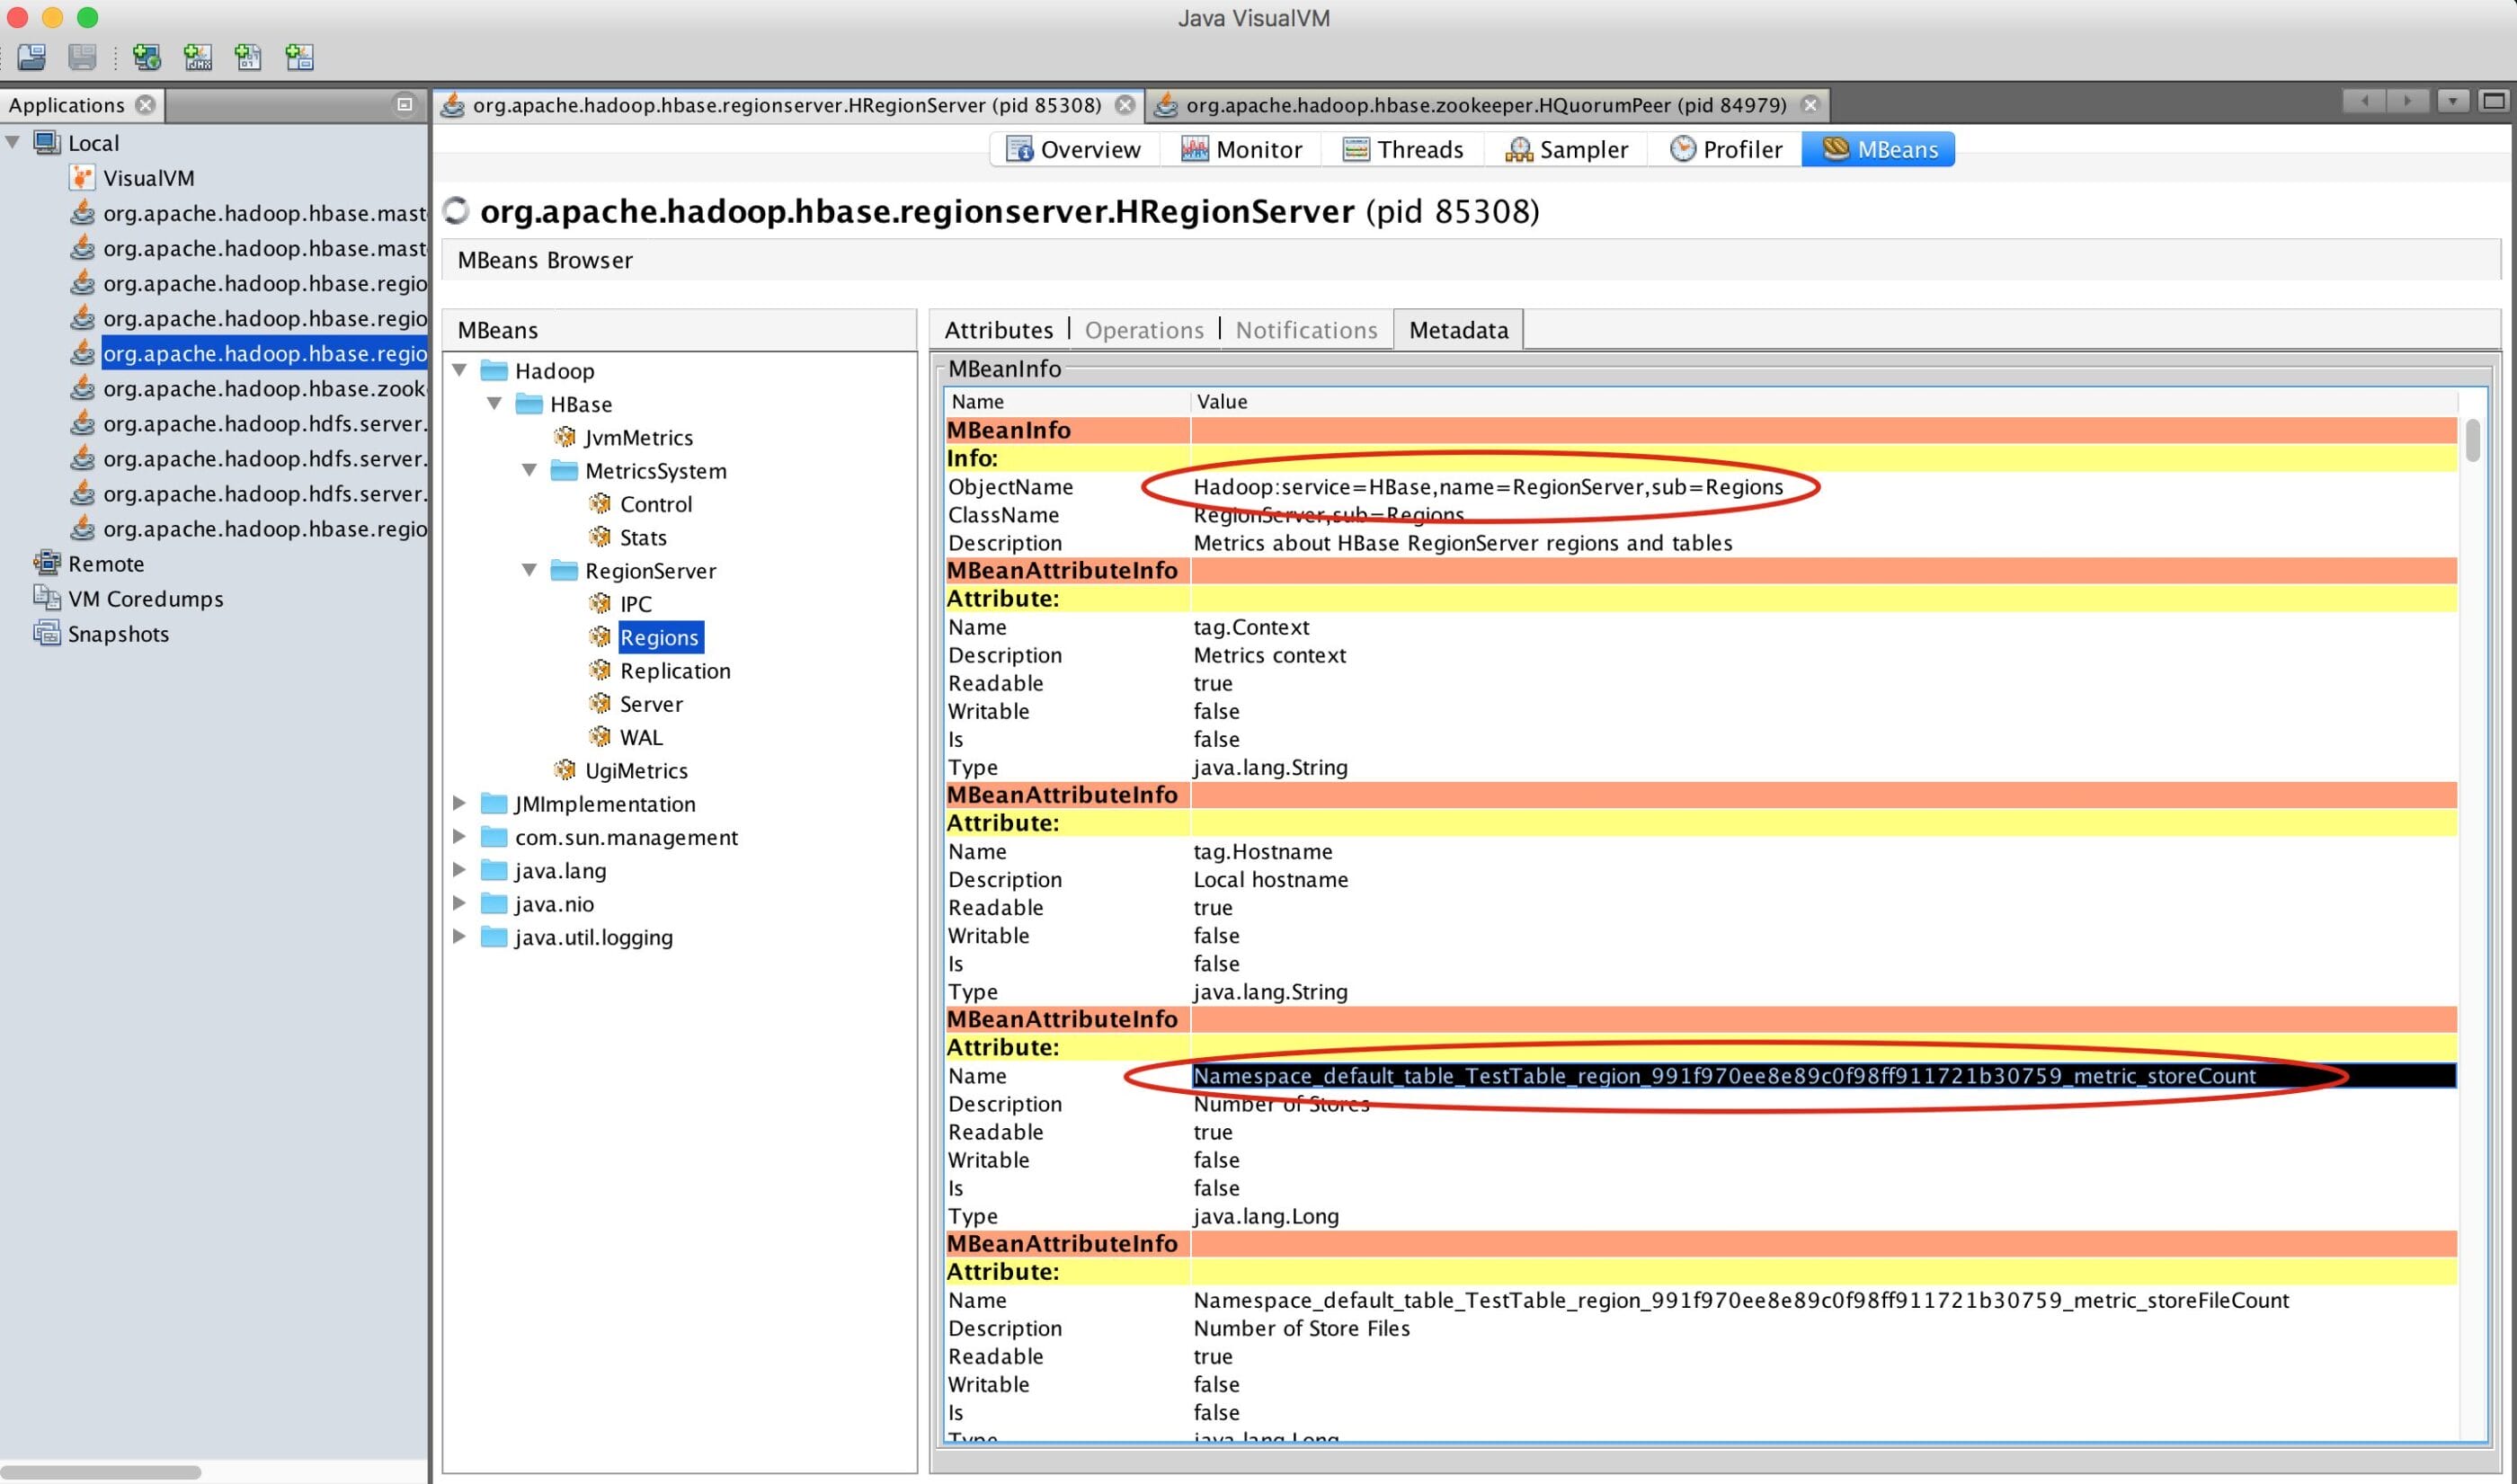
The MBeans are matched against the pattern. In JVisualVM we can open the metadata tab and inspect the MBeans more closely to match the pattern:

The pattern format is:
Hadoop: part before the colon in ObjectName<service name="RegionServer," sub="Regions"></service>: comma seperated MBean properties, the part after the colon in ObjectName: match tabular data here. Not used in HBase MBeans.Namespace_([^W_]+)_table_([^W_]+)_region_([^W_]+)_metric_(w+): regex to match the attribute name.[^W_]+matches alphanumeric characters except underscores.
The selected parts between parentheses can be used to compose the exposed metric name and labels. There is one downside to using a custom config.yaml: all MBeans are matched against the given patterns. If an MBean does not match any pattern, it will not be exposed! There is no fallback to the default pattern.
Documentation and more examples can be found on jmx_exporter.
Conclusion
I’ve shown a way to expose HBase JMX metrics in Prometheus’ metrics format and visualize in Grafana. Not all Hadoop-related tools have a nice UI but with this setup we can easily gather metrics from JVM-based applications. I’ve submitted a PR to the Prometheus JMX exporter GitHub for the config file and would like to encourage you to do the same if you’ve written one.
To experiment with the setup in this blogpost yourself, I’ve created a repository on my GitHub.
References
- Prometheus JMX exporter
- Images made with draw.io
- HBase: The Definitive Guide


