Blog
Monitoring dbt model and test executions using Elementary Data

dbt is a great tool to do your data transformations, and it is widely adopted within modern data stacks all around the world. I have worked with several clients over the past two years which were already using dbt, or were migrating their transformation workloads towards dbt. I really like most aspects of dbt, however, one problem that I often face is the lack of monitoring capabilities within dbt. Yes, dbt does provide logs to the stdout for every model and test execution, however in my opinion this is not sufficient to base your whole monitoring around. These log records will show the name of the model or test, the execution time, and the execution status (passed, warned, or failed). Besides that the logs will also show the number of records and bytes processed per model execution, and in case of a test that did not pass, the number of records that it warned or failed upon.
This gives some high-level information, however it is hard to determine what the actual SQL is that was executed, and on which exact records a data quality test failed or raised a warning. Logs will purely show information about a single run, so you don't have an easy way to see how a test performs over time. In my opinion, it is very interesting to see how data quality is improving or regressing over time. For example when you take certain actions in the source systems (e.g. fixing a record with issues), it is nice to see what effect it has on your overall data quality.
This is where the dbt artifacts come into play. Whenever dbt runs (e.g. dbt build | test | run | compile commands being executed), dbt generates some so called artifacts in the form of json files. These artifact files contain a lot of metadata and more in-depth information about your model and test executions, and therefore can be very useful. These artifact files are generated in the ./target directory of your dbt project.
Let’s imagine we are running dbt as a container within a cloud run job (a cloud-native container runtime within Google Cloud). Every morning when all the raw source data is ingested, we spin up a container via a trigger to do our daily data transformation workload using dbt. However, when the dbt workload finishes and the container shuts down, these artifact files containing a lot of meaningful information about the dbt invocations are lost. To solve this problem it is possible to build a subsequent step in the form of a script or application to parse these artifact files and store them somewhere. However, this requires a lot of custom engineering work and is not an easy task. Besides that you need to create a dashboard on top of this artifact data, to get meaningful insights out of it.
Luckily, there is an open-source solution for this called Elementary Data.
Elementary Data
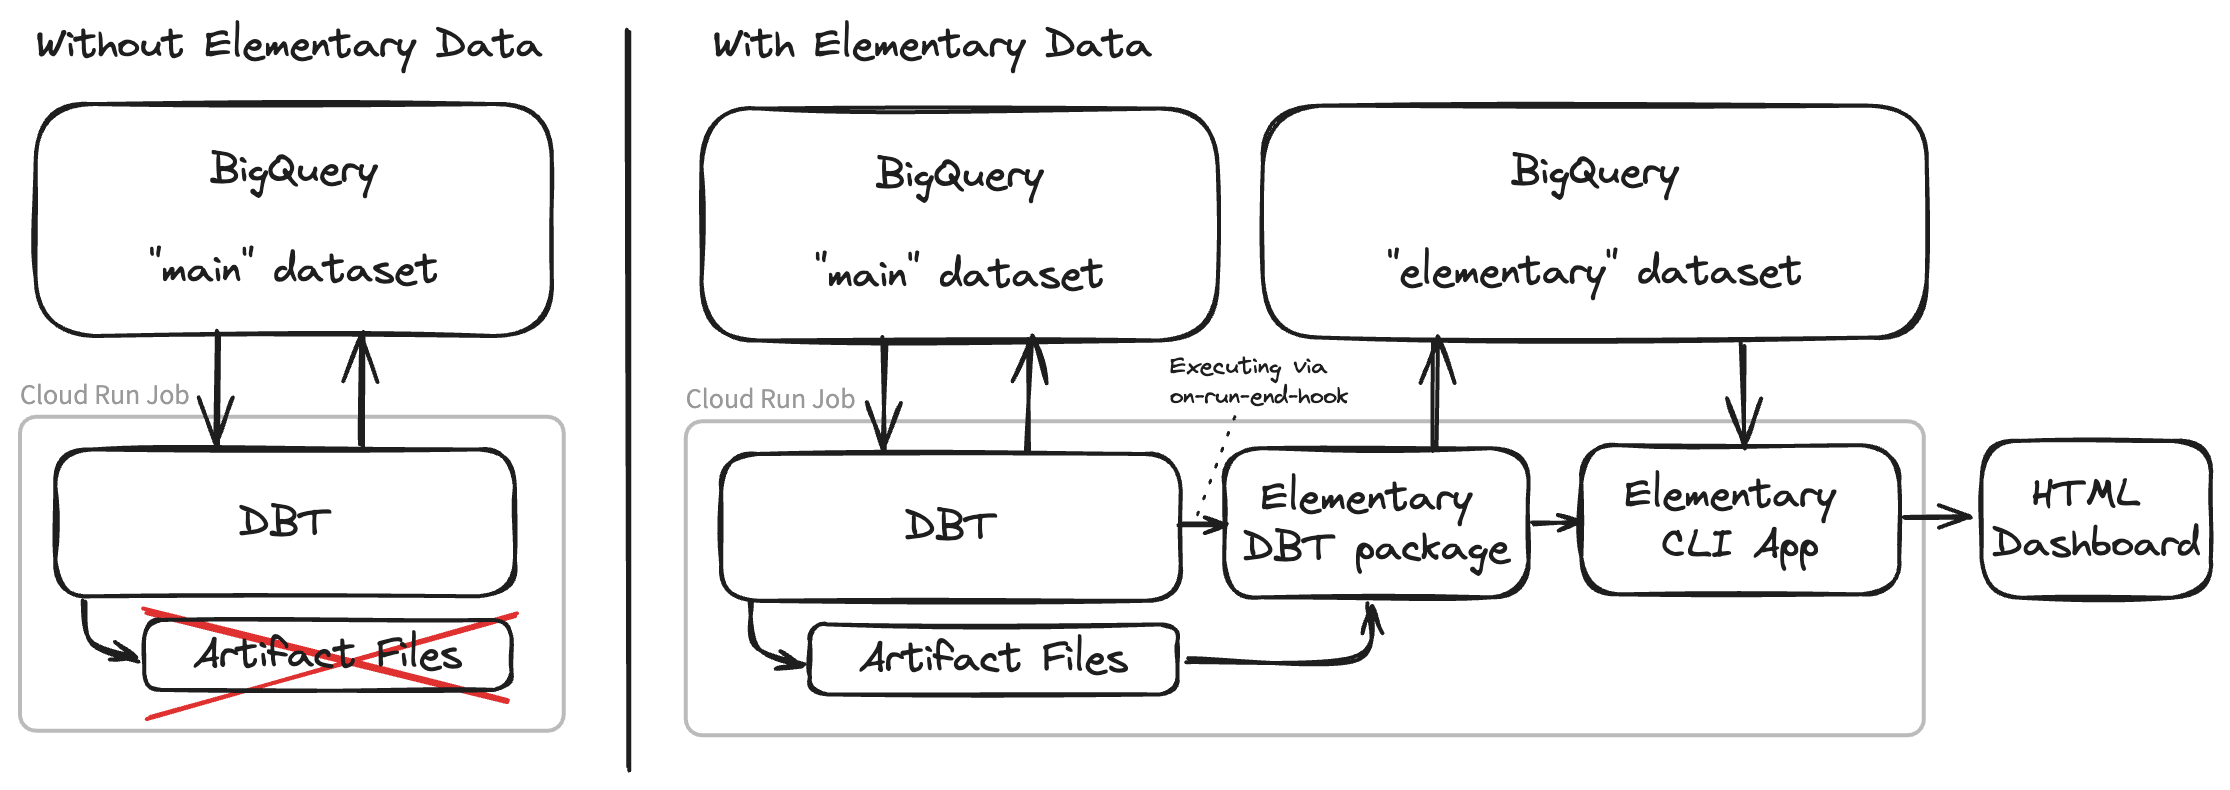
Elementary Data consists of two components, a dbt package and a CLI application. The dbt package leverages the on-run-end-hook functionality of dbt, and automatically parses and uploads the dbt artifact files into your data warehouse as incremental tables. Elementary can be configured to put these models into a separate schema from the rest of your data.
The CLI application offers a way to generate a predefined dashboard out of your dbt artifacts data. The CLI tool will query your elementary tables in the warehouse and generate an insightful over-time dashboard about your dbt model and test executions. This dashboard is in the form of one single HTML file, including all the required data in a base64 encoded json string. You can let Elementary automatically upload this dashboard file to object storage such as GCS, S3, or Azure Blob. Another option is to upload the dashboard file to a web server yourself. This dashboard offers a lot more insightful information about your dbt tests and model executions compared to the standard dbt logs. It offers a great interface and can be used in your daily monitoring process. For instance, you can see your test execution history for a single test over time and detect anomalies. It is also a good starting point for debugging data quality issues, because it offers an easy way to copy the actual compiled SQL that was executed for a given test.
 Click here to play around with the demo dashboard yourself
One of the features I really like in Elementary's dashboard, is that you can copy the compiled SQL for a failed data quality test with just one click. This offers great (and fast) debugging capabilities because you can paste this query directly into the query runner of your data warehouse. This opens the possibility of starting to investigate the cause of the data quality issue right away. Without access to the compiled SQL you need to determine what the test is about purely based on the name of the test (which is partly generated) and the source code. Compiled SQL, on the other hand, is a lot more useful because it represents the actual SQL that was executed for that specific test.
Next to a nice dashboard about your dbt invocations, Elementary offers a lot more functionality. They have an alerting solution, which can send alerts to Slack (and in the future more channels) when tests or models are failing. They also have a set of specific elementary tests, that can be used to implement anomaly detection or detect schema changes within your source data. They offer a data catalog and many more useful features around data observability. Some of which are part of their SaaS offering, however, most core functionality is free to use.
Setting-up Elementary for your dbt project
The following example is based upon the standard dbt jaffle_shop project.
Jaffle shop is a fictional e-commerce store, and is widely used within the dbt community as a demo project
dbt Plugin
To install the dbt package, add the following to your packages.yml file, and run dbt deps to install the dependencies. In case you do not have a packages.yml file yet, you can create one in the root of your dbt project.
packages:
  - package: elementary-data/elementary
    version: 0.13.1
In your dbtproject.yml file, add the following configuration to enable the package. Optionally, you can also specify the enabled property to enable or disable the package for a specific environment. The schema name will be prefixed with the name of the schema defined in your profiles.yml file. In the case of the jaffle shop example, that will be mainelementary.
models:
  jaffle_shop:
      materialized: table
      staging:
        materialized: view
  elementary:
    +schema: "elementary"
    # enabled: "{{ target.name in ['prod', 'test'] }}"
Next, you need to create the elementary models in your warehouse. You can do this by running the following command.
dbt run --select elementary
This will create empty tables and a couple of views. These tables will be updated with the artifacts data in your future dbt executions. Now let's validate the installation by running some dbt tests and see if the data is being populated in the tables.
dbt test
After running some tests, take a look at your elementary_test_results table.
You should see some data in there ️
CLI Application
You can install the CLI application using pip. To install it use the following command:
pip install elementary-data
Next you need to install one of the extra dependencies for the data warehouse that you are using. The options are:
pip install 'elementary-data[snowflake]'
pip install 'elementary-data[bigquery]'
pip install 'elementary-data[redshift]'
pip install 'elementary-data[databricks]'
After this step, you can verify if your installation is successful by running the following command. In case edr is not recognized as a command, you can follow the troubleshooting guide from Elementary.
edr --help
Awesome!
You have successfully installed the Elementary dbt package and CLI application.
Now you are ready to generate your first Elementary dashboard. To do this you require a profiles.yml file, which contains a read configuration for your elementary schema.
jaffle_shop:
  target: dev
  outputs:
    dev:
      type: postgres
      host: 127.0.0.1
      user: postgres
      password: "1234"
      port: 5432
      dbname: jaffle_shop
      schema: main
      threads: 4
elementary:
  target: elementary
  outputs:
    elementary:
      type: postgres
      host: 127.0.0.1
      user: postgres
      password: "1234"
      port: 5432
      dbname: jaffle_shop
      schema: main_elementary
      threads: 4
You can generate the dashboard by running the following command from you dbt working directory, for more CLI options please check the CLI documentation.
edr report
--target-path <OUTPUT_PATH>
--profiles-dir <PROFILES_DIRECTORY>
When running the command you will see the following output, when Elementary is finished it will automatically open the dashboard in your browser.
Conclusion
Elementary seems like a great OSS solution for observing your dbt workloads. It offers a lot of useful features, and is simple to set-up. It is a great addition to your dbt project, and I would definitely recommend to give it a try. It offers an excellent interface to observe your data quality, and start debugging data quality issues right away. Next to that, it offers some unique tests around anomaly detection and a data catalog. Unfortunately, I did not have the chance to try it out in a production environment yet, but I am definitely planning to do so in the future to find out if it fits most of my dbt observability needs.
Please leave me a message if you have any questions or remarks about this blog post.
Photo by Ibrahim Boran on Unsplash
Frequently Asked Questions
Written by
Ramon Vermeulen
Cloud Engineer
Our Ideas
Explore More Blogs


From Spec to Code: Building Software with Spec Kit
This article walks through the full workflow, from installation to a working implementation, covering both greenfield projects and extending an...
Hidde de Smet, Emanuele Bartolesi


Contact