Introduction
Data modelling is the process of creating a structured representation of an organisation's business processes. It details the relationships between entities, which constraints apply, and how data should be stored in a data warehouse. Data modelling is fundamental to efficient database development and maintenance and, ultimately, accurate business insights.
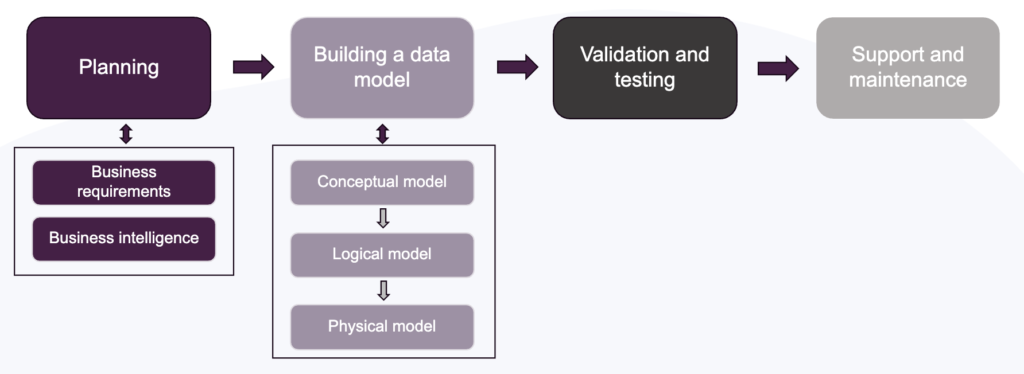
Developing a data model begins with planning and gathering business requirements. Once the expectations are clear, the next step is to build the data model itself, starting with the conceptual model, then the logical model, and finally the physical model. This is followed by validation and testing, with ongoing support and maintenance.
One of the most popular data modelling frameworks is dimensional modelling. It has been around for decades, popularised by Ralph Kimball's launch of The Data Warehouse Toolkit in 1996. With a focus on simplicity and symmetry, it continues to be relevant for a wide range of use cases, industries, and data stacks.
But what exactly is dimensional modelling? What are these techniques? Let's check out some core concepts and how they relate to the lifecycle presented.
Core concepts
According to Kimball's methodology, the four steps to design a dimensional model are:
- Select the business process;
- Identify the grain;
- Identify the dimensions;
- Identify the facts;
Step one translates to choosing a process that is relevant to your stakeholders. Step two identifies the most atomic level of information that needs to be stored in the fact table. In step three, given the outlined fact table, it's time to identify the dimensions that are related to it. Finally, step four outlines the numeric facts that populate the fact table rows.
Dimension tables contain descriptive attributes of a business entity and typically have a primary key (PK) that uniquely identifies a row. Fact tables contain numerical and measurable data representing business events, where each row represents one event observation. Fact tables have foreign keys (FK) columns that can be linked to dimension tables.
Referring to the lifecycle depicted above, these four steps can be tied to the Planning and Building a data model blocks.
Let's imagine that Xebia Data wants to investigate our core business model: consultancy project sales - the business process that we are interested in. In terms of the grain, we are interested in daily records of invoice payments, since different clients can pay at different dates. What is now left is to identify the dimensions and facts.
In the lifecycle of a data modelling project, we saw that building a model involves a conceptual, logical, and physical phase. The conceptual model is a high-level representation of an organization's business processes and doesn't include the data's technical details, such as how it will be stored. The logical model, on the other hand, expands the conceptual model into a more detailed representation, defining entities, attributes, and relationships. Lastly, the physical model emphasises specific optimisations for the database and physical storage of the data.
With our Xebia Data business process, a simplified conceptual model could be:
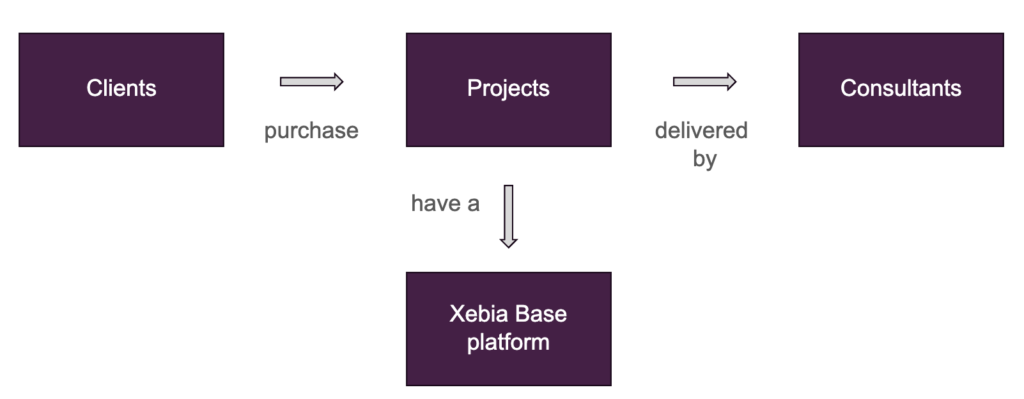
The next phase is to translate the conceptual model into a logical one. During this part, it's common to determine which data modeling framework will be used. One popular example is Kimball's Star Schema approach. With Star Schema, a central fact table is linked to dimension tables through FKs. In our example, a potential fact table could be an invoice sales table, where the process of clients purchasing (paying) an invoice is tracked. Moreover, looking at the conceptual model, dimension tables such as consultants, projects, clients, Xebia Base platforms, and dates would provide relevant context to these purchases.
Our Star Schema model would then have the following structure:
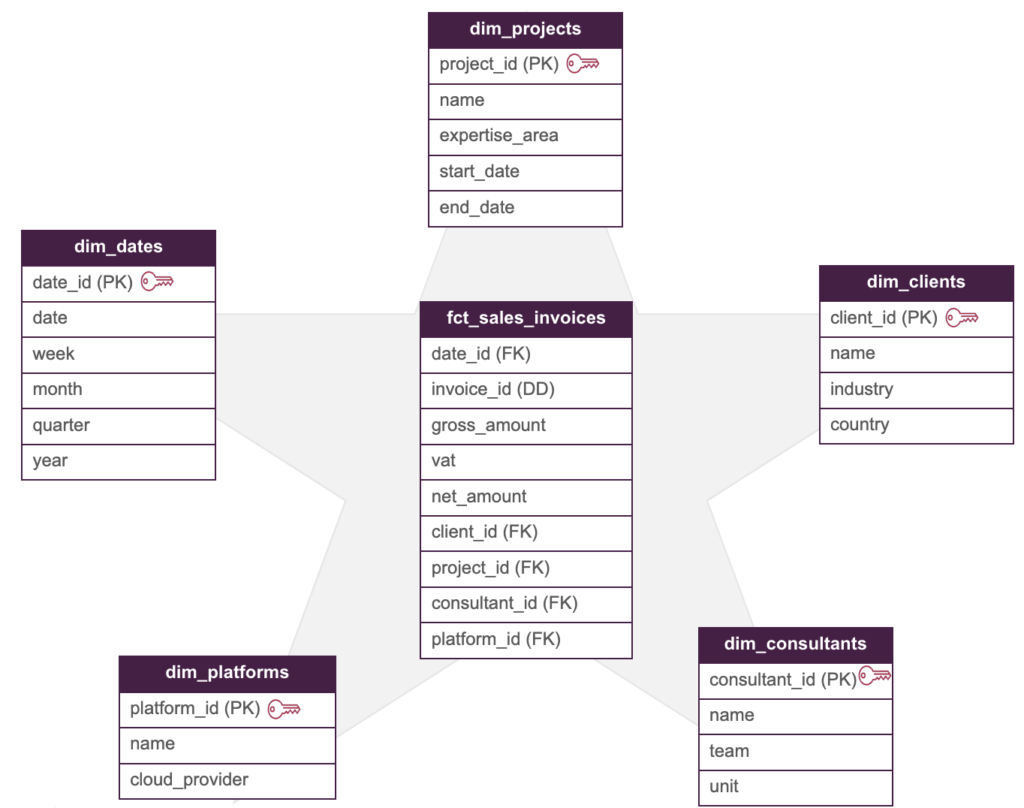
Where the invoice identifier (invoice_id) is a degenerate dimension.
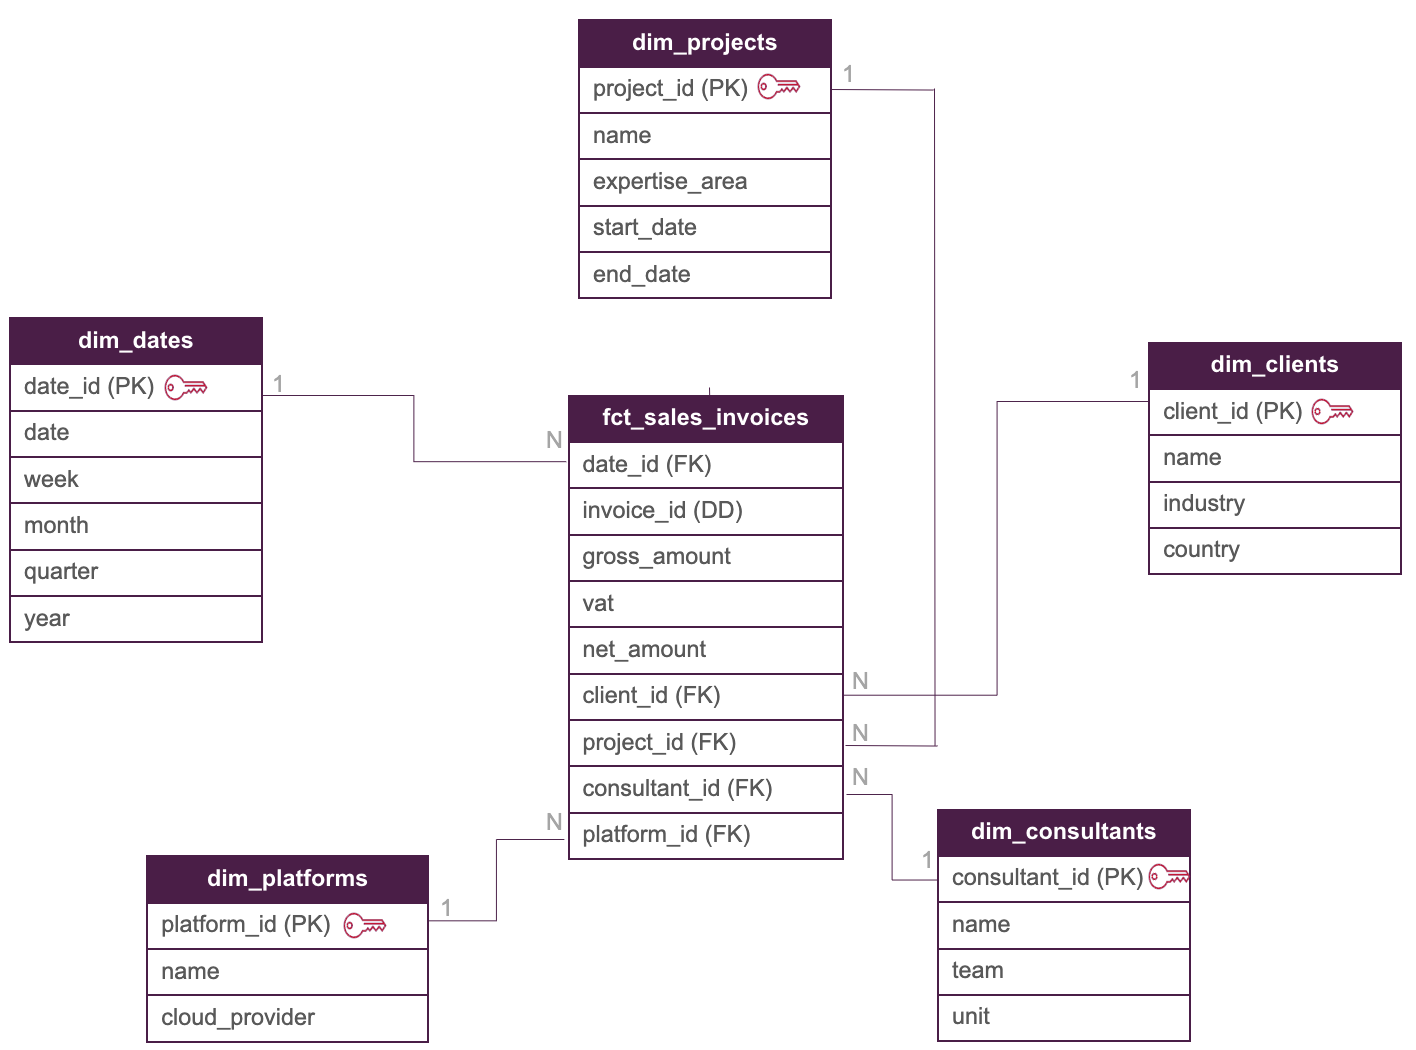
The relationship between dimension tables and the fact table would be one-to-many: meaning that there is one record (PK) in a dim table connected to many records (FK) in the fact one, resulting in our logical model:
Looking at the lifecycle of a data modelling project, the next step in Building a data model is developing the physical implementation. For this phase, it is important to define the correct data types, column constraints and adequate testing to ensure the model integrity. But what could you use to adhere to all these requirements?
How dbt can support dimensional modelling
dbt is a SQL-first data transformation tool that supports software engineering best practices in analytics workflows. With dbt, raw data is transformed into consumable datasets, and transformations can be tested, version controlled and tracked through a comprehensive model and column-level lineage. Instead of modeling data in a BI tool or in notebooks, engineers and analysts can leverage dbt’s functionality to develop version-controlled SQL code.
With dbt, implementing the physical model becomes a streamlined and scalable process. Models' generic tests can be configured in yaml files, making validation, testing and maintenance straightforward. With the widely-used dbt project structure of staging, intermediate and marts models, the transformations required to deliver dimension and fact tables can be broken down into modular layers. Dimension and fact tables are then often placed into marts, where they are made available for consumption by BI tools and business users.
Often a mart model is a SQL query that selects a set of columns from an intermediate model. In our consultancy business example, the dim_clients table could be defined in dbt as:
{{
    config(materialized = "table")
}}

SELECT
client_id,
name,
industry,
country

from {{ref('int_clients_joined_addresses')}}
Where int_joined_clients_addresses would be an intermediate model joining different staging tables in order to extract the necessary information for our dimension table.
In the model's yaml file, data types and tests can be configured. As an example, below is displayed how the dim_clients table yaml file could be set up:
version: 2

models:
   - name: dim_clients
     description: This table contains all Xebia Data's clients.
     columns:
       - name: client_id
         data_type: int
         description: Primary key of this table.
         tests:
           - unique
           - not_null
       - name: name
         data_type: string
         description: The name of the client.
       - name: industry
         data_type: string
         description: The industry of the client.
       - name: country
         data_type: string
         description: The country of the client.
Where client_id (PK) is tested for null values and uniqueness through the dbt generic tests not_null and unique.
Although our fictitious Xebia Star Schema model looks quite simple, in real business use cases there are multiple types of facts and dimensions. For instance, facts can be additive, semi-additive, and non-additive. Moreover, there is even the possibility to have factless fact tables! You can imagine that as businesses grow, so do their processes and complexity. Therefore, defining a robust analytics workflow is essential to develop accurate and reliable insights.
Advantages and disadvantages of dimensional modelling
As mentioned previously, one of the main advantages of dimensional modeling is its simplicity. Due to its symmetry and intuitive structure, it is a representation easily understandable by different types of stakeholders. Additionally, its flexibility and extensibility can accommodate new business requirements as companies grow.
On the other hand, there are some disadvantages. Ambiguity can be challenging when identifying and mapping business processes, especially when there isn't a clear data owner. Moreover, since Kimball's approach is based on critical business needs, it doesn't offer from the start a complete view on the whole enterprise data.
These can be summarised as:
Advantages
- Simplicity, easy to understand by the business
- Incremental approach means lower upfront cost
- Extensible, focus can be on departmental data needs
Disadvantages
- Ambiguity can be challenging
- Data redundancy
- Incomplete due to business critical approach
Still, it remains a powerful framework applicable to a wide range of applications - retail, e-commerce, banking, inventory, among others. Data teams and organizations can adapt it to their own needs, making concessions where necessary and mitigating these disadvantages.
Conclusion
In this blog, we learned that Kimball dimensional modelling has been around for many decades. Still, it continues to be relevant to today's data challenges. Due to its simplicity and symmetry with dimensions, facts and Star Schema, it can be easily adopted and understood by business and technical users.
We also saw that when paired up with dbt, transformations workflows can be easily tracked and tested, making validation and maintenance easier. With dbt, dimensional data modelling's simplicity is enabled at scale.
Are you part of an organization looking into implementing best practices around data modelling and transformation? Our analytics engineer consultants are there to help - just contact us and we'll get back to you soon. Or are you an analyst, analytics engineer or data engineer interested in learning more about Kimball and dbt? Check out our Data Warehousing and Data Modeling course at Xebia Academy.
We wish you the best in your data modelling journey!
Written by
Taís Laurindo Pereira
Taís is one of the co-authors of Fundamentals of Analytics Engineering. She has worked with analytics & data science since 2018 for a diverse range of companies - from big corporations to scale-ups. Since 2023, she has been working as a consultant at Xebia, implementing analytics engineering solutions at different clients. Besides working as a consultant, she also gives trainings about various data analytics tools and topics. With a mixed academic background in engineering and business, her mission is to contribute to data democratization in organizations through analytics engineering best practices.
Contact