Blog
Improve your Functional Monitoring with the Functional Monitoring Quadrants

Functional monitoring is a crucial part of any successful Continuous Delivery implementation.
We often see development teams having difficulty striking the right balance between different kinds of monitoring, focusing on observability primarily in terms of technical metrics like error rate. Technical metrics are helpful but might not tell the whole story. For instance, all services could be “green”, while our customers experience broken functionality.
Functional Monitoring helps bridge the gap between technical metrics and real user impact to make the observability of the system complete. To help create an effective strategy for Functional Monitoring we developed the Functional Monitoring Quadrants.
Functional Monitoring Quadrants
The quadrants consist of 4 complementary types of Monitoring that, when combined, will make it easier to create a complete strategy for validating functional correctness.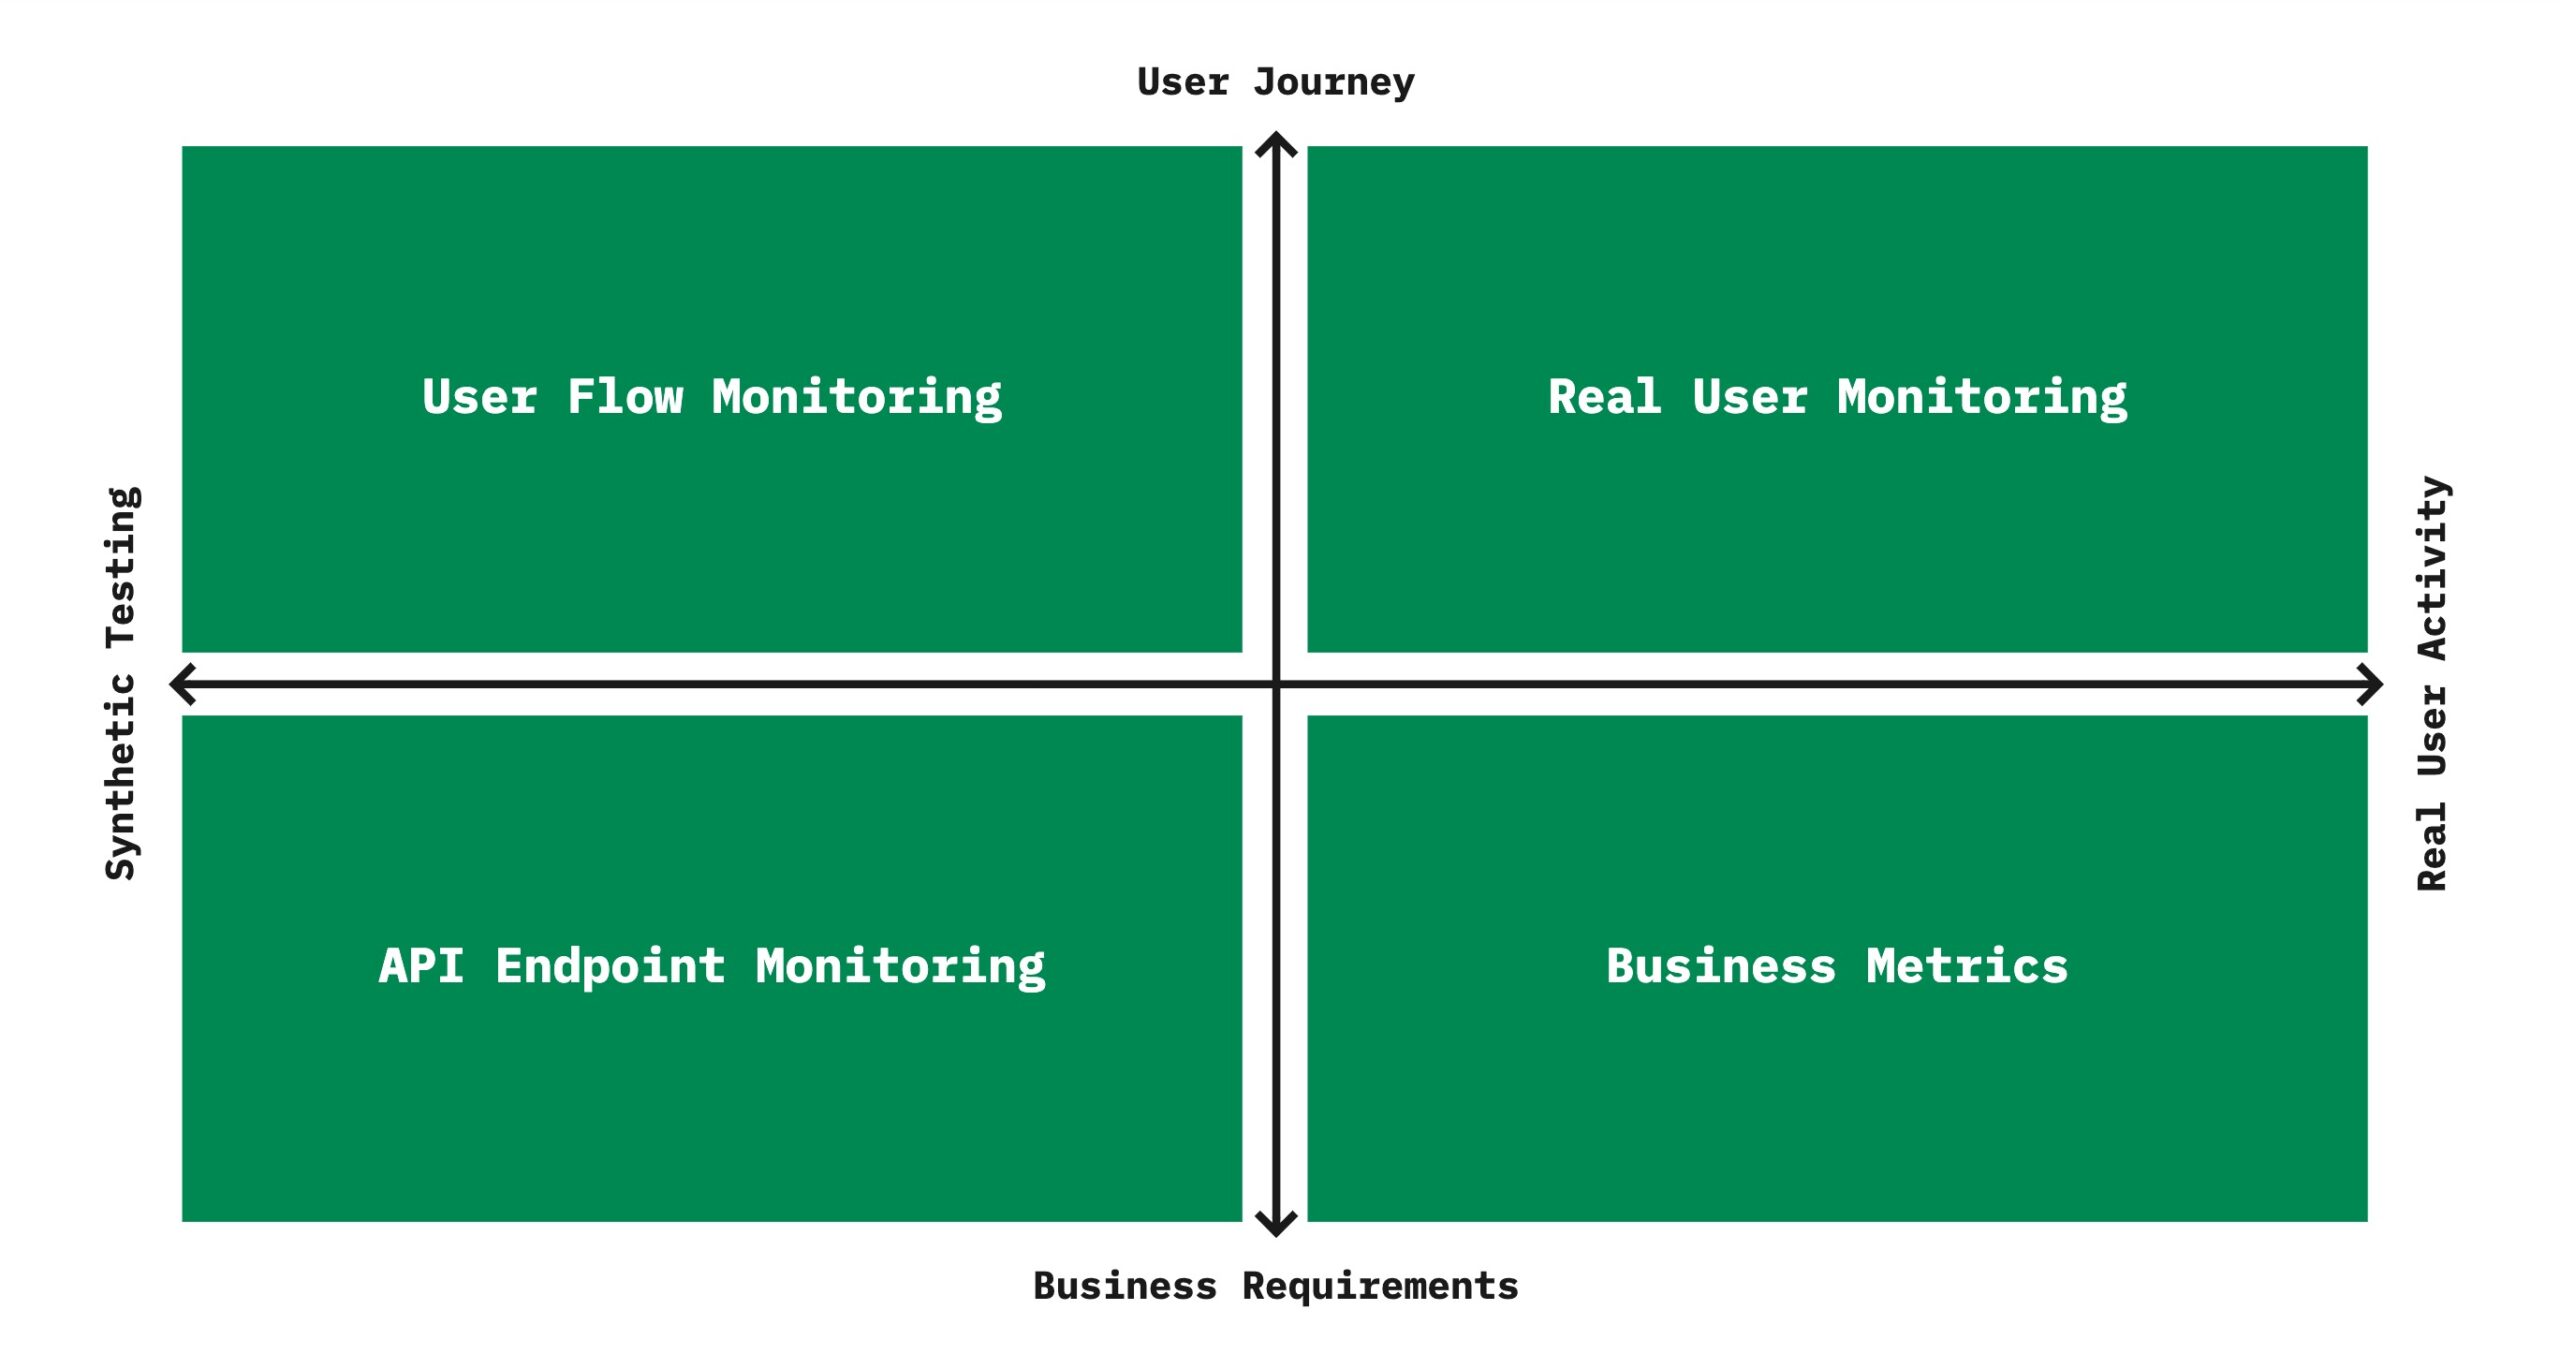
Synthetic Testing versus Real User Activity
With Synthetic Testing, we continuously get information about the availability of the system. We generate the information about the system by executing tests in production according to a schedule (e.g., every 5 minutes). The downside is that it is not the “real” user experience: We make assumptions based on the most common usage.
With Real User Activity we generate information based on actual usage. We could say the results are more truthful than synthetic tests, but we depend on the amount of traffic being generated by actual users. For example, when there is little usage at night, problems might go undetected.
User Journey versus Business Requirements
We gain insight in the user experience by measuring each step of the User Journey. To achieve this you could, for example, play a recorded flow through the 5 most important User Journeys on a regular interval or you could insert some JavaScript (client-side code) to measure where users drop off or experience problems.
Business Requirements focuses on measuring trends like anomalies detection based on, for example, the number of orders being lower than expected for the time of the day or the API call for adding to a basket giving an incorrect number of products.
Complementary information
These different perspectives matter and give us specific insights, while they also have their limitations. Together they paint a complete picture. Let’s look at the examples to learn more.
Functional Monitoring in real life
Case study: A checkout flow
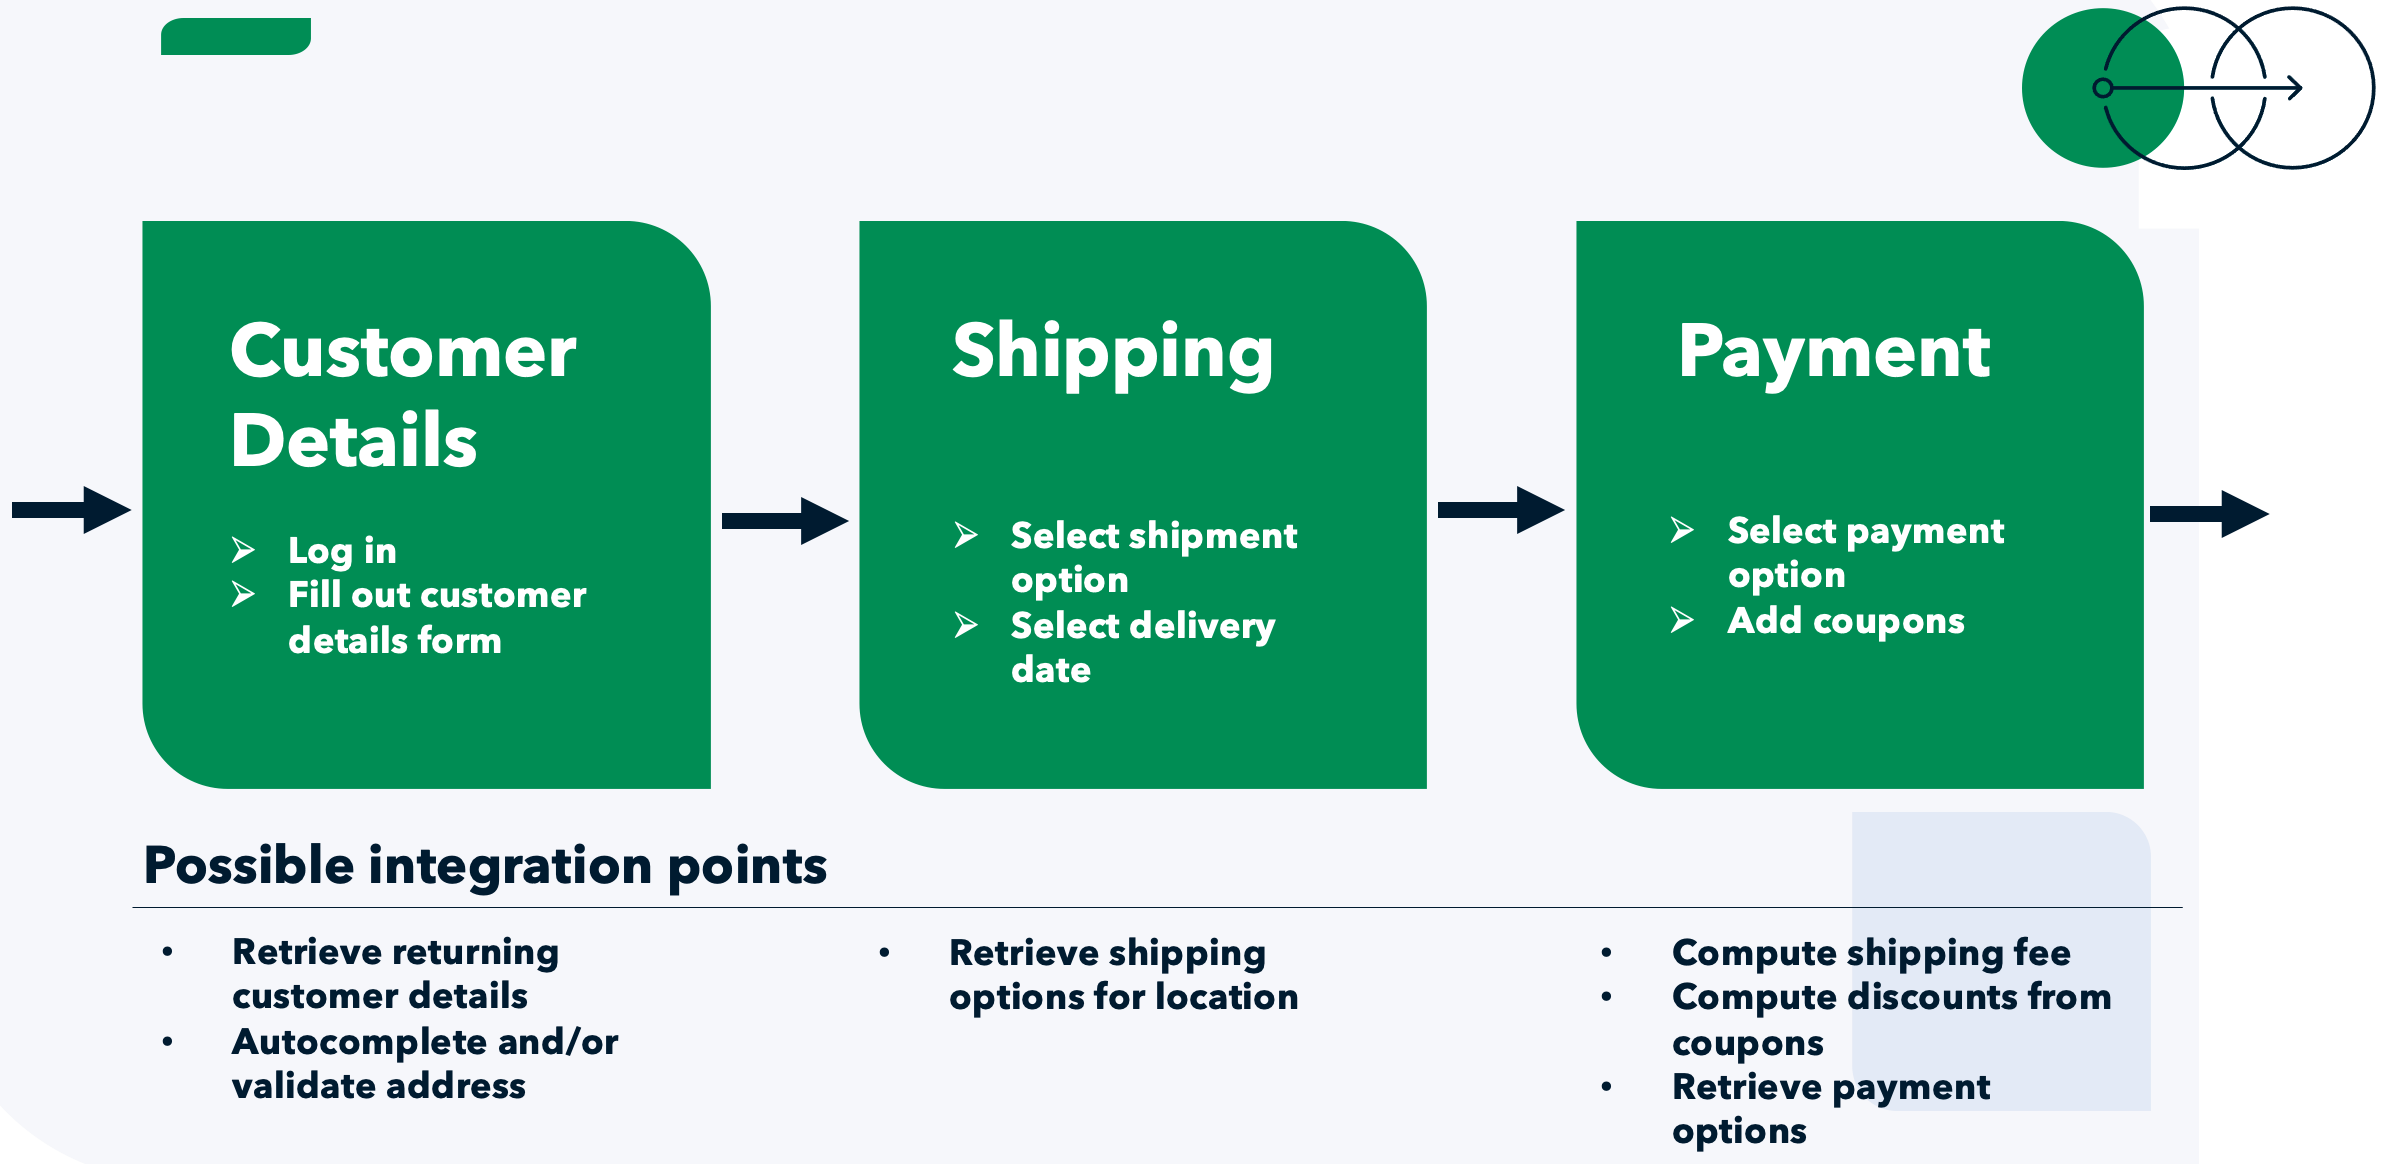
To give you an idea how these Quadrants can be used, I am going to use a generic case study that a lot of you can relate to: a checkout process.
It consists of 3 steps:
- Customer Details
- Shipping
- Payment
We have some integrations with internal and external services like a payment service provider. We want to be in control and not blindly trust on the external service.
How could we approach this checkout flow? What kind of monitoring can we do in each quadrant?
Quadrant 1: User Flow Monitoring
The “User flow monitoring” quadrant aims to gain insight into the availability and performance of a critical business flow from a user’s perspective. We can do this by replaying a recorded checkout at specific intervals and validating that all the steps work as expected and timely.
This style of monitoring has its limitations. We only replay the happy flow based on our assumptions. Users might follow a different path with unexpected problems, and these will not be found pro-actively using this method. Also, the recorded flow is subject to continuous maintenance.
Quadrant 2: Real User Monitoring
Many observability tools will offer a simple library you can include in your application’s front-end to perform “real user monitoring.” With “real user monitoring,” we can cover some of the limitations of the first quadrant.
The goal of this quadrant is to measure the actual availability and performance of the website from the user’s perspective. These measurements can provide insight into the experience of real users in the different parts of the checkout flow and even at what point they might drop off.
This quadrant is, of course, not without its limitations. When there is less data available, for example, when fewer users shop at night, measurements are more scattered. The data is also less uniform because the performance measurements can be impacted by the capabilities of devices and the user’s connectivity.
Quadrant 3: Business Metrics
Using “Business metrics” to monitor a critical business flow can be a powerful addition to your monitoring efforts. Users can complete their journey through the checkout flow without issues, and your monitoring for the first two quadrants can confirm as much. Still, there is a big problem when we don’t produce corresponding orders after the user completes checkout and payment.
A likely metric you keep track of from a business perspective is the number of orders created. We can use this metric to detect anomalies and monitor them. Within this quadrant, we aim to look at the critical business metrics for the flow you want to monitor and determine how you can use these metrics to signal problems. Take into account that anomaly detection is less valuable when there is a low amount of traffic.
Quadrant 4: API Endpoint Monitoring
Finally, there are business requirements we want to monitor with small synthetic tests. We create these tests to detect issues fast and predictably. For example, we can continuously check that the payment-options call gives me the correct payment options, which might have easily been missed by the monitoring for the other quadrants.
With these small checks, you only measure the parts but not the sum of the parts, which is the main benefit and, at the same time, its limitation.
Conclusion
We’ve seen examples of a test in each Quadrant. The Quadrants can help you build functional monitoring that is complementary to technical metrics. When combining functional and technical monitoring you gain a complete picture of the correctness of your system. This way you will get in control, gain confidence, and will be able to determine the real impact of incidents.
Dive in deeper?
Get in touch!
Authors
Bert Rijsdijk with Jochum Börger
Written by
Bert Rijsdijk
I help teams to speed up and improve the complete software delivery process. My mission is to get software in the hands of users faster by reducing time to market, enabling early feedback, and giving development teams the capabilities they need to succeed.
Our Ideas
Explore More Blogs


From Spec to Code: Building Software with Spec Kit
This article walks through the full workflow, from installation to a working implementation, covering both greenfield projects and extending an...
Hidde de Smet, Emanuele Bartolesi


Contact