Blog
Deploying Grafana to Azure App Service with Terraform (and Active Directory integration)

Intro
Grafana is a free and open source platform which allows you to query, visualize, alert on and understand your metrics.
As your system grows bigger and has more moving parts, it becomes vital to be able to tell wheter it's healthy and operational at a glance.
In Azure you can get your Grafana up and running by different means:
Use Azure Managed Grafana
This is a fully managed service which can become a feasible option if there are no resources to spare on maintaining your monitoring solution. You can be sure that your managed Grafana instance will be up-to-date with the latest patches.
The downside of this approach is the price - it would cost ~5.7 euros per user per month at the time of writing, which is not too expensive if you don't need a lot of people to have access to the dashboard. Another limitation is that you can't install custom plugins due to security concerns.
Deploy Grafana on Azure App Service
This option would shift more responsibility to the engineers as they would be responsible for making sure that the Grafana instance is patched and has all the necessary plugins installed. On the bright side, you will have more control over the platform and you don't have to pay per user.
Prerequisites
In order to provision these resources, you will need:
- Terraform (v1.1.9 at the time of writing)
- Azure account with Owner rights on your subscription
- Azure CLI
- sqlite
Provisioning
Providers
Let's first log in to AzureCLI
az loginAfter it's successful, we can initialize Terraform. We'll need two providers: azurerm and random.
terraform {
  required_providers {
    azurerm = {
      source  = "hashicorp/azurerm"
      version = "~>3.0"
    }
    azuread = {
      source  = "hashicorp/azuread"
      version = "~> 2.15.0"
    }
    random = {
      source  = "hashicorp/random"
      version = "3.1.0"
    }
  }
}

provider "azurerm" {
  features {}
}

provider "random" {
}

provider "azuread" {
  tenant_id = data.azurerm_client_config.current.tenant_id
}
In case you want to use remote backend (as you probably should), don't forget to configure it in the terraform block. We'll omit it for the purpose of this post.
After your providers are configured, we can initialize the working directory.
terraform initBootstrap the infrastructure
In our example we'll monitor a PostgreSQL database, all resources will be deployed to one resource group to simplify the setup. Let's create the resource group.
locals {
  location            = "westeurope"
  resource_group_name = "grafana"
}

resource "azurerm_resource_group" "rg" {
  name     = local.resource_group_name
  location = local.location
}
Let's also create the keyvault to store our admin password in. We could also use Terraform output to read the password, keyvault way would allow your colleagues to access the credentials without having to work with Terraform.
locals {
  ...
  kv_name             = "grafanakv"
}

data "azurerm_client_config" "current" {}

resource "azurerm_key_vault" "kv" {
  name                       = local.kv_name
  location                   = azurerm_resource_group.rg.location
  resource_group_name        = azurerm_resource_group.rg.name
  tenant_id                  = data.azurerm_client_config.current.tenant_id
  soft_delete_retention_days = 7
  purge_protection_enabled   = false

  sku_name = "standard"

  access_policy {
    tenant_id = data.azurerm_client_config.current.tenant_id
    object_id = data.azurerm_client_config.current.object_id

    secret_permissions = [
      "Get", "List", "Purge", "Set", "Delete", "Recover"
    ]
  }
}
We are also giving our logged-in user access to the secrets in this keyvault, if more users/groups will need it, you can always add more access_policy blocks.
With the keyvault in place, we can create the database server
locals {
  ...
  postgres_name  = "grafana"
  database_name  = "data"
  sql_admin_name = "sqladmin"
}

resource "random_password" "password" {
  length  = 16
  special = true
}

resource "azurerm_key_vault_secret" "password" {
  name         = "db-password"
  value        = random_password.password.result
  key_vault_id = azurerm_key_vault.kv.id
}

resource "azurerm_postgresql_server" "source" {
  name                          = local.postgres_name
  location                      = azurerm_resource_group.rg.location
  resource_group_name           = azurerm_resource_group.rg.name
  public_network_access_enabled = true

  administrator_login              = local.sql_admin_name
  administrator_login_password     = azurerm_key_vault_secret.password.value
  backup_retention_days            = 7
  sku_name                         = "B_Gen5_1"
  ssl_enforcement_enabled          = false
  ssl_minimal_tls_version_enforced = "TLSEnforcementDisabled"
  storage_mb                       = 5120
  version                          = "11"
}
And the database itself
resource "azurerm_postgresql_database" "db" {
  name                = local.database_name
  resource_group_name = azurerm_resource_group.rg.name
  charset             = "UTF8"
  collation           = "English_United States.1252"
  server_name         = azurerm_postgresql_server.source.name
}
Provisioning Grafana
With the resources in place, we can provision the monitoring infrastructure. The first thing to do is to create the Log Analytics Workspace.
locals {
  ...
  log_analytics_workspace_name = "log-analytics"
}

resource "azurerm_log_analytics_workspace" "logs" {
  name                = local.log_analytics_workspace_name
  location            = local.location
  resource_group_name = local.resource_group_name
  sku                 = "PerGB2018"
  retention_in_days   = 30
}
Next we'll create the service principal in order to connect to Azure AD, generate password for it and store it in our keyvault
locals {
  ...
  ad_app_display_name = "grafana"

  microsoft_graph = {
    app_id = "00000003-0000-0000-c000-000000000000" # Microsoft Graph
    scopes = [
      "37f7f235-527c-4136-accd-4a02d197296e", # openid
      "64a6cdd6-aab1-4aaf-94b8-3cc8405e90d0", # email
      "14dad69e-099b-42c9-810b-d002981feec1", # profile
    ]
  }
}

resource "azuread_application" "grafana" {
  display_name = local.ad_app_display_name
  web {
    homepage_url  = "https://${local.app_service_name}.azurewebsites.net"
    redirect_uris = ["https://${local.app_service_name}.azurewebsites.net/login/generic_oauth"]
  }
  identifier_uris = ["api://${local.ad_app_display_name}"]
  owners          = [data.azuread_user.owner.id]

  required_resource_access {
    resource_app_id = local.microsoft_graph.app_id
    dynamic "resource_access" {
      for_each = local.microsoft_graph.scopes
      content {
        id = resource_access.value
        type = "Scope"
      }
    }
  }
}

resource "azuread_application_password" "grafana" {
  application_object_id = azuread_application.grafana.object_id
}

resource "azurerm_key_vault_secret" "password" {
  name         = "grafana-app-password"
  value        = azuread_application_password.grafana.value
  key_vault_id = data.azurerm_key_vault.kv.id
}

resource "azuread_service_principal" "grafana" {
  application_id = azuread_application.grafana.application_id
  owners         = [data.azuread_user.owner.id]
}
This service principal will need to have Monitoring Reader role on our resource group:
resource "azurerm_role_assignment" "grafana_monitoring_reader" {
  scope                = data.azurerm_resource_group.rg.id
  role_definition_name = "Monitoring Reader"
  principal_id         = azuread_service_principal.grafana.id
}
web and required_resource_access sections are needed in order to be able to log into Grafana using your AzureAD user. Keep in mind that owner part is quite important, otherwise you won't be able to do anything with the service principal and will basically be locked out of it.
One more prerequisite is to provision Storage Account with a share for Grafana to store its data in.
locals {
  ...
  storage_account_name = "grafanastorage"
  grafana_share_name   = "grafana-share"
}

resource "azurerm_storage_account" "storage" {
  name                     = local.storage_account_name
  resource_group_name      = azurerm_resource_group.rg.name
  location                 = azurerm_resource_group.rg.location
  account_tier             = "Standard"
  account_replication_type = "LRS"
  account_kind             = "StorageV2"
  is_hns_enabled           = true
}

resource "azurerm_storage_share" "grafana" {
  name                 = local.grafana_share_name
  storage_account_name = data.azurerm_storage_account.storage.name
  quota                = 50
}
There's an issue with Grafana that it might not be able to create and initialize the database and you will get database is locked error. In order to mitigate this, you can create an empty sqlite database:
mkdir assets
sqlite3 assets/grafana.db 'PRAGMA journal_mode=wal;'
and upload it to the share:
resource "azurerm_storage_share_file" "grafana_db" {
  name             = "grafana.db"
  storage_share_id = azurerm_storage_share.grafana.id
  source           = "assets/grafana.db"
}
With all the prerequisites in place, we're ready to deploy our App Service hosting Grafana.
locals {
  ...
  app_service_plan_name = "grafana-asp"
  app_service_name      = "grafana"
}

resource "azurerm_service_plan" "grafana" {
  name                = local.app_service_plan_name
  location            = local.location
  resource_group_name = local.resource_group_name
  os_type             = "Linux"
  sku_name            = "B1"
}

resource "azurerm_linux_web_app" "grafana" {
  name                = local.app_service_name
  location            = local.location
  resource_group_name = local.resource_group_name
  service_plan_id     = azurerm_service_plan.grafana.id

  site_config {
    application_stack {
      docker_image     = "grafana/grafana"
      docker_image_tag = "latest"
    }
  }

  app_settings = {
    "GF_SERVER_ROOT_URL"                          = "https://${local.app_service_name}.azurewebsites.net"
    "GF_SECURITY_ADMIN_USER"                      = data.azuread_user.owner.user_principal_name
    "GF_INSTALL_PLUGINS"                          = "grafana-clock-panel,grafana-simple-json-datasource"
    "GF_AUTH_GENERIC_OAUTH_NAME"                  = "Azure AD"
    "GF_AUTH_GENERIC_OAUTH_ENABLED"               = "true"
    "GF_AUTH_GENERIC_OAUTH_CLIENT_ID"             = azuread_application.grafana.application_id
    "GF_AUTH_GENERIC_OAUTH_CLIENT_SECRET"         = azuread_application_password.grafana.value
    "GF_AUTH_GENERIC_OAUTH_SCOPES"                = "openid email name"
    "GF_AUTH_GENERIC_OAUTH_AUTH_URL"              = "https://login.microsoftonline.com/${data.azurerm_client_config.current.tenant_id}/oauth2/authorize"
    "GF_AUTH_GENERIC_OAUTH_TOKEN_URL"             = "https://login.microsoftonline.com/${data.azurerm_client_config.current.tenant_id}/oauth2/token"
    "GF_AUTH_GENERIC_OAUTH_API_URL"               = ""
    "GF_AUTH_GENERIC_OAUTH_TEAM_IDS"              = ""
    "GF_AUTH_GENERIC_OAUTH_ALLOWED_ORGANIZATIONS" = ""
  }

  storage_account {
    access_key   = data.azurerm_storage_account.datalake.primary_access_key
    account_name = data.azurerm_storage_account.datalake.name
    name         = local.app_service_name
    share_name   = azurerm_storage_share.grafana.name
    type         = "AzureFiles"
    mount_path   = "/var/lib/grafana/"
  }

  logs {
    http_logs {
      file_system {
        retention_in_mb   = 35
        retention_in_days = 5
      }
    }
  }

  depends_on = [
    azurerm_storage_share_file.grafana_db
  ]
}
Please note that our current logged in user will be assigned an admin role (see GF_SECURITY_ADMIN_USER environment variable).
Connecting Grafana to Azure Monitor
After the configuration is applied, you can log in to your app service and if everything is correct, you'll see Grafana welcome screen:
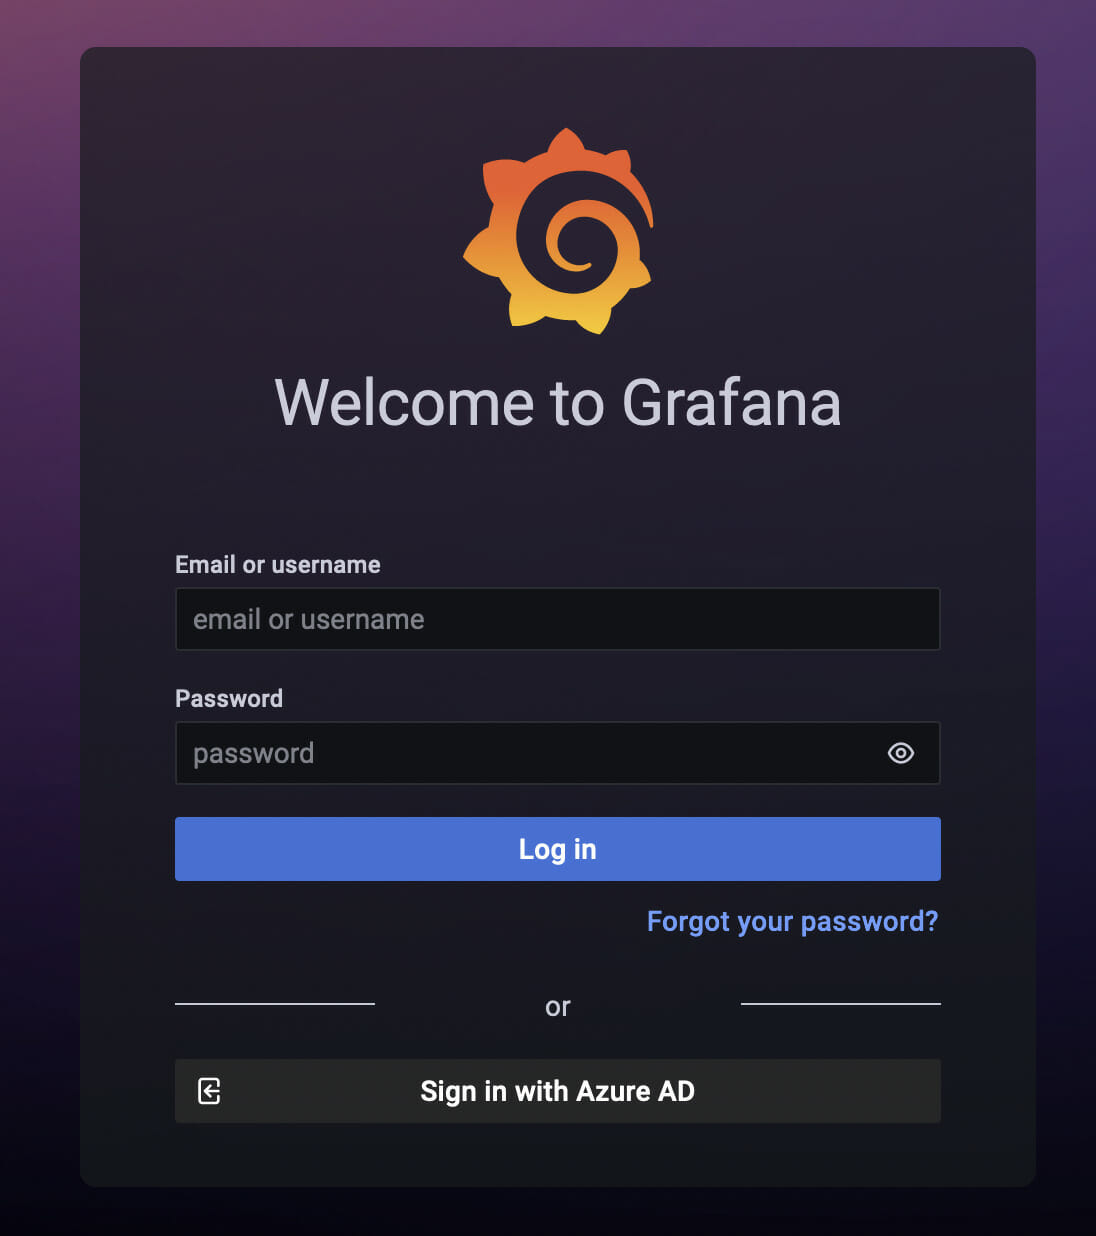
where you can click on "Sign in with Azure AD".
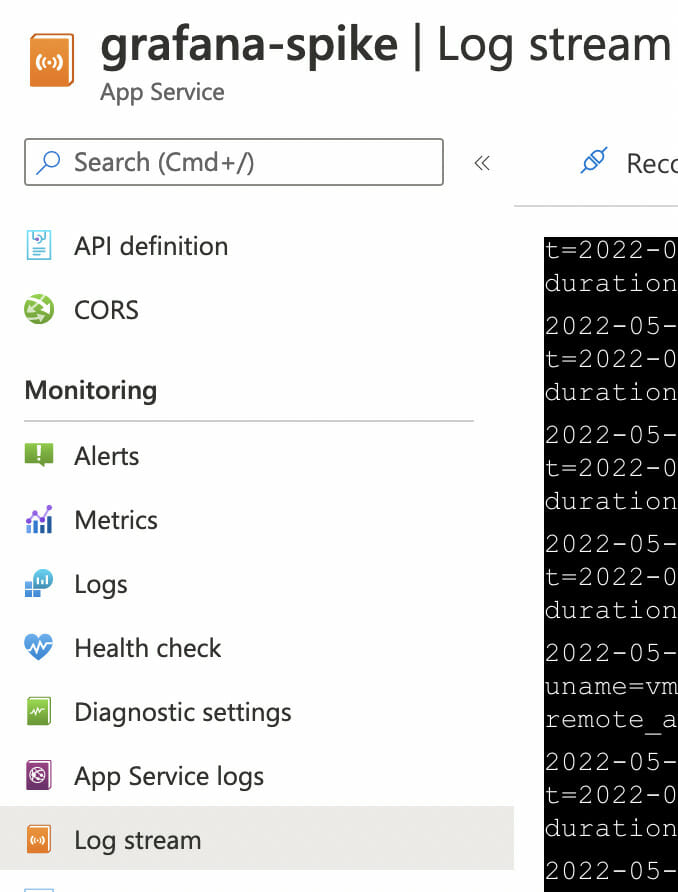
In case the page doesn't load, you can check the logs on the Log Stream:
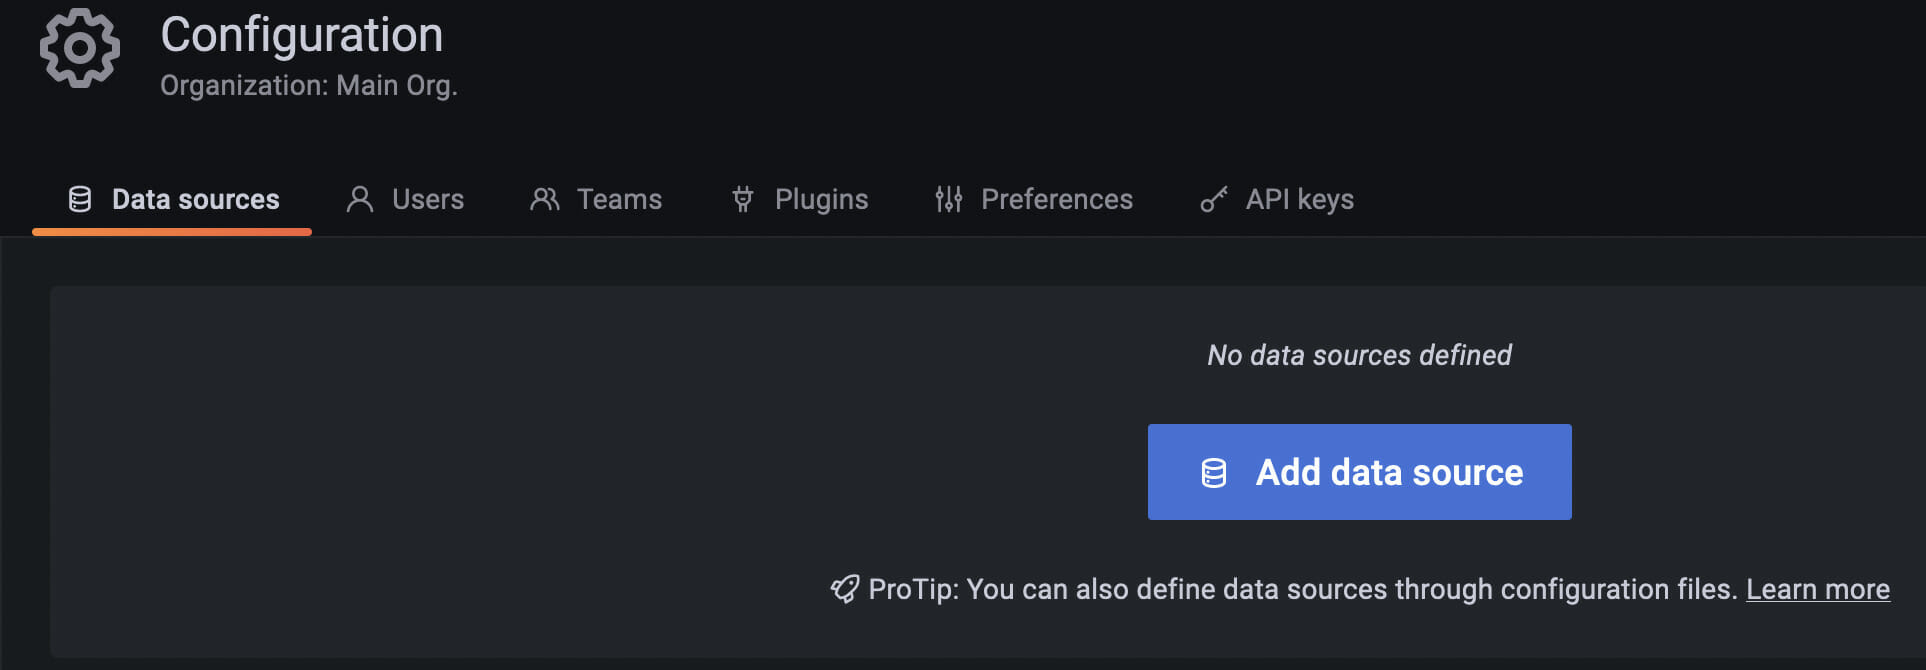
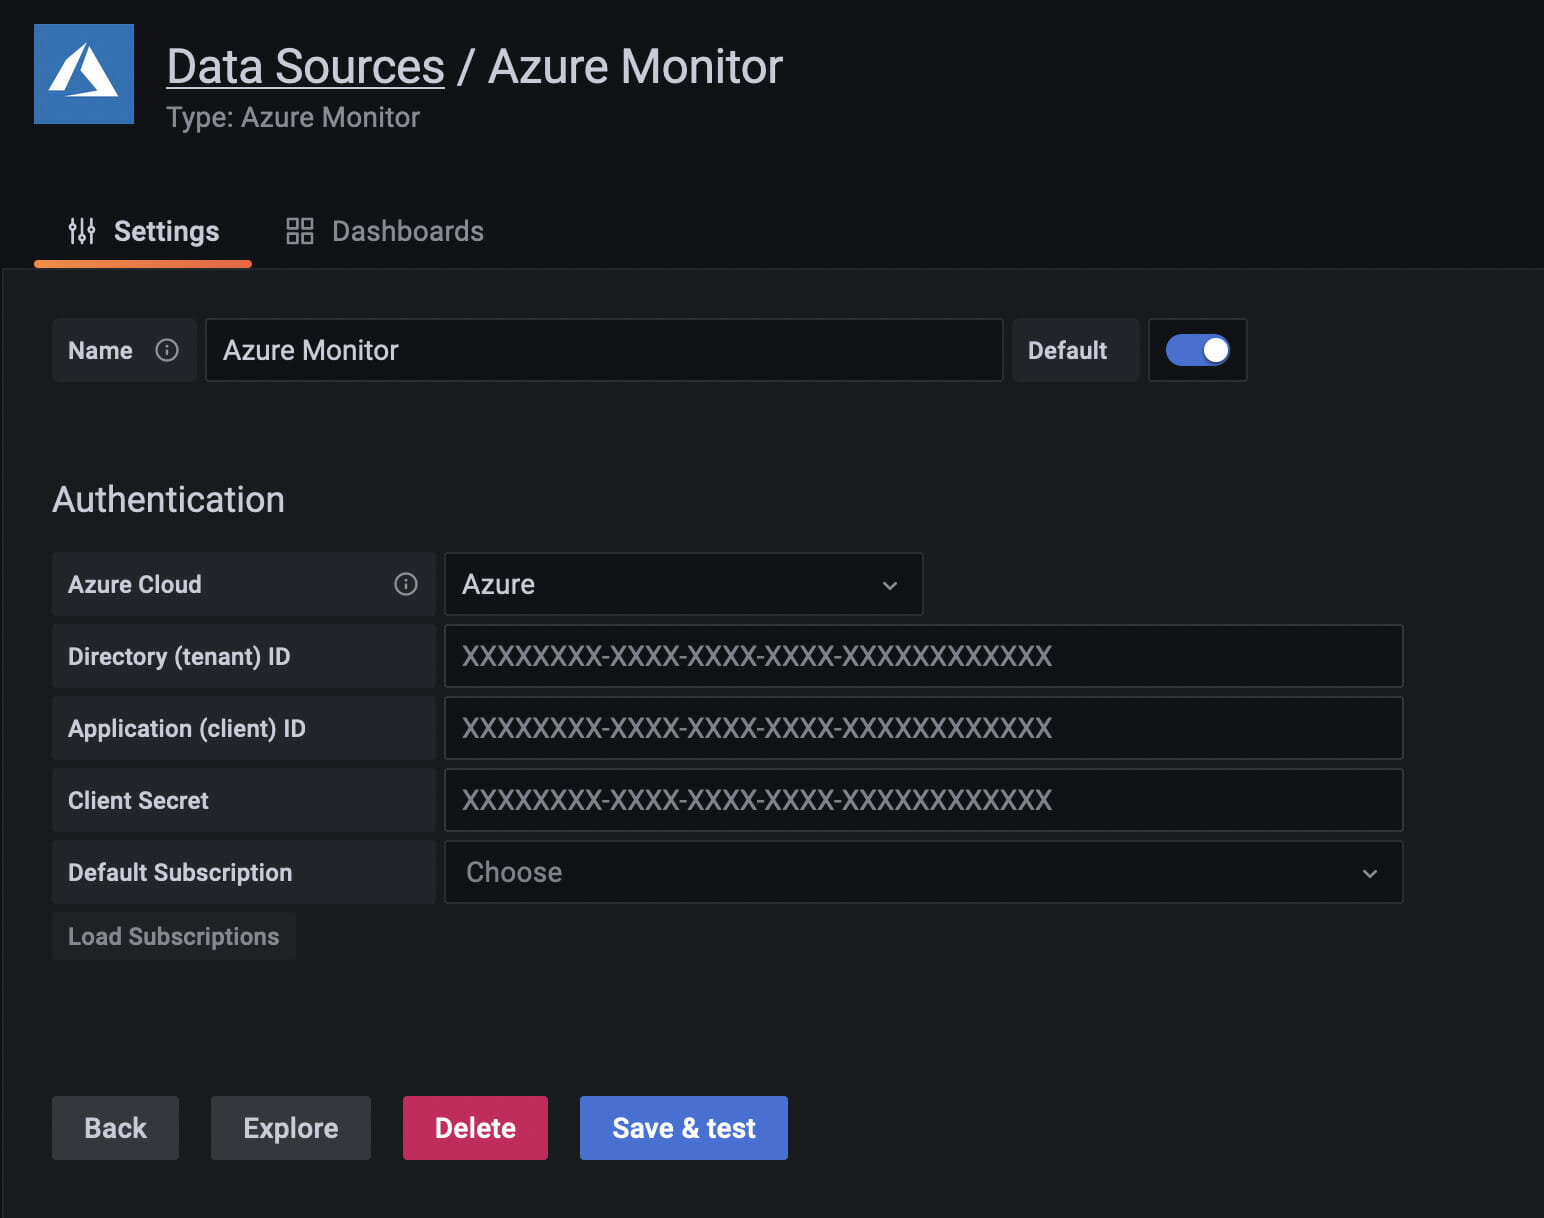
After logging in, we need to add a new Data Source of type Azure Monitor. Data sources can be added from the Configuration page:
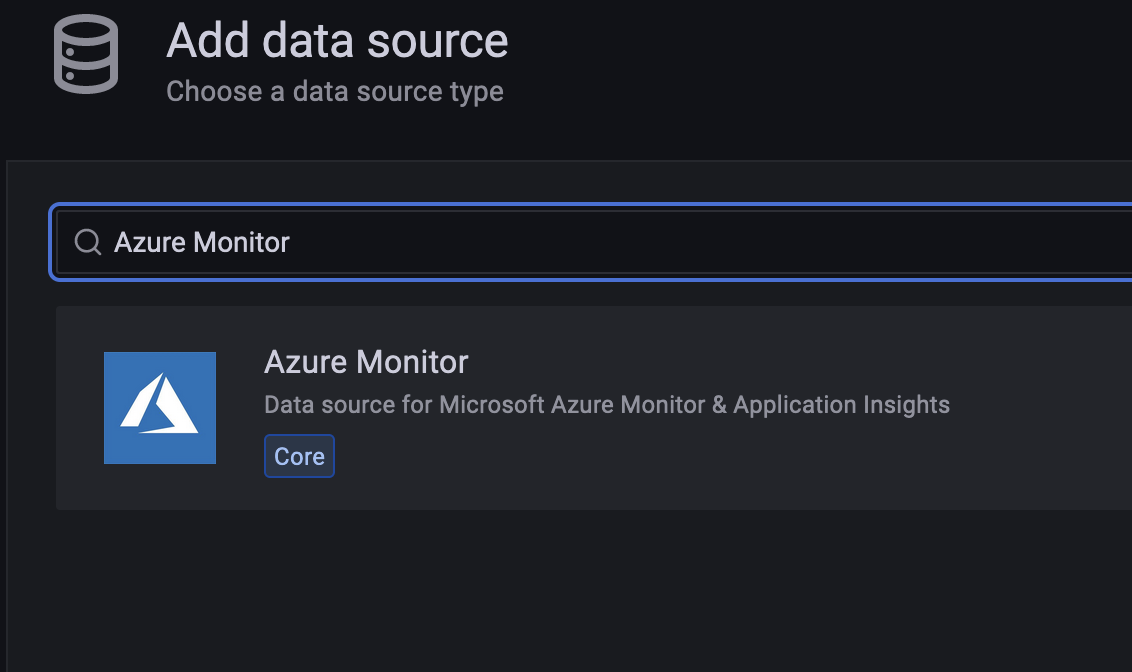
Search for Azure Monitor and add it
Fill in the credentials
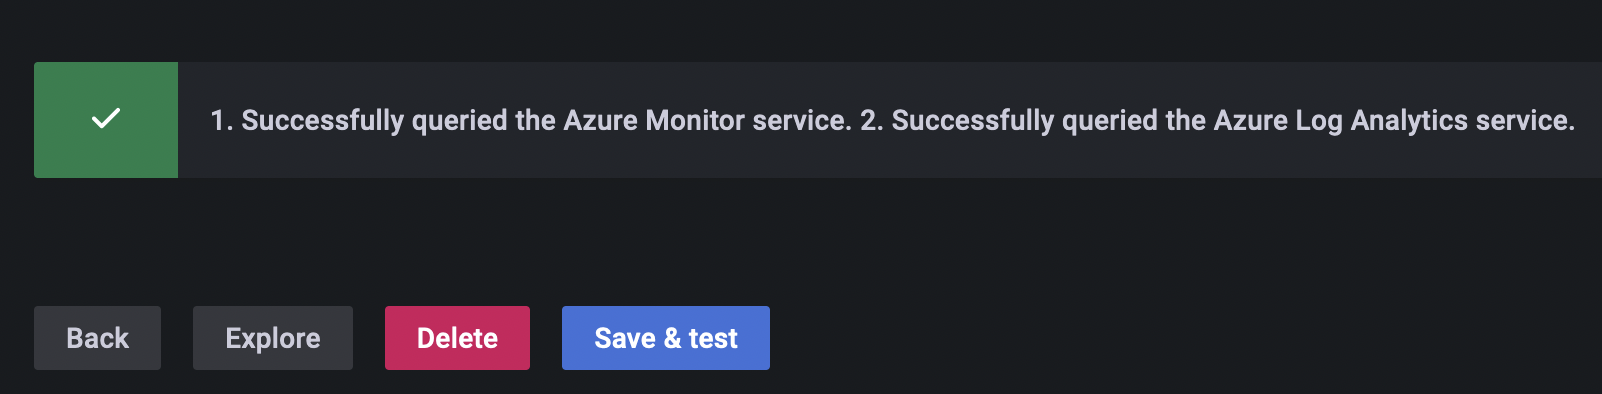
And you should see that Grafana was able to connect to Azure Log Analytics service
Displaying PostgreSQL metrics
Let's see if we can create a dashboard with our PostgreSQL CPU utilization metric.
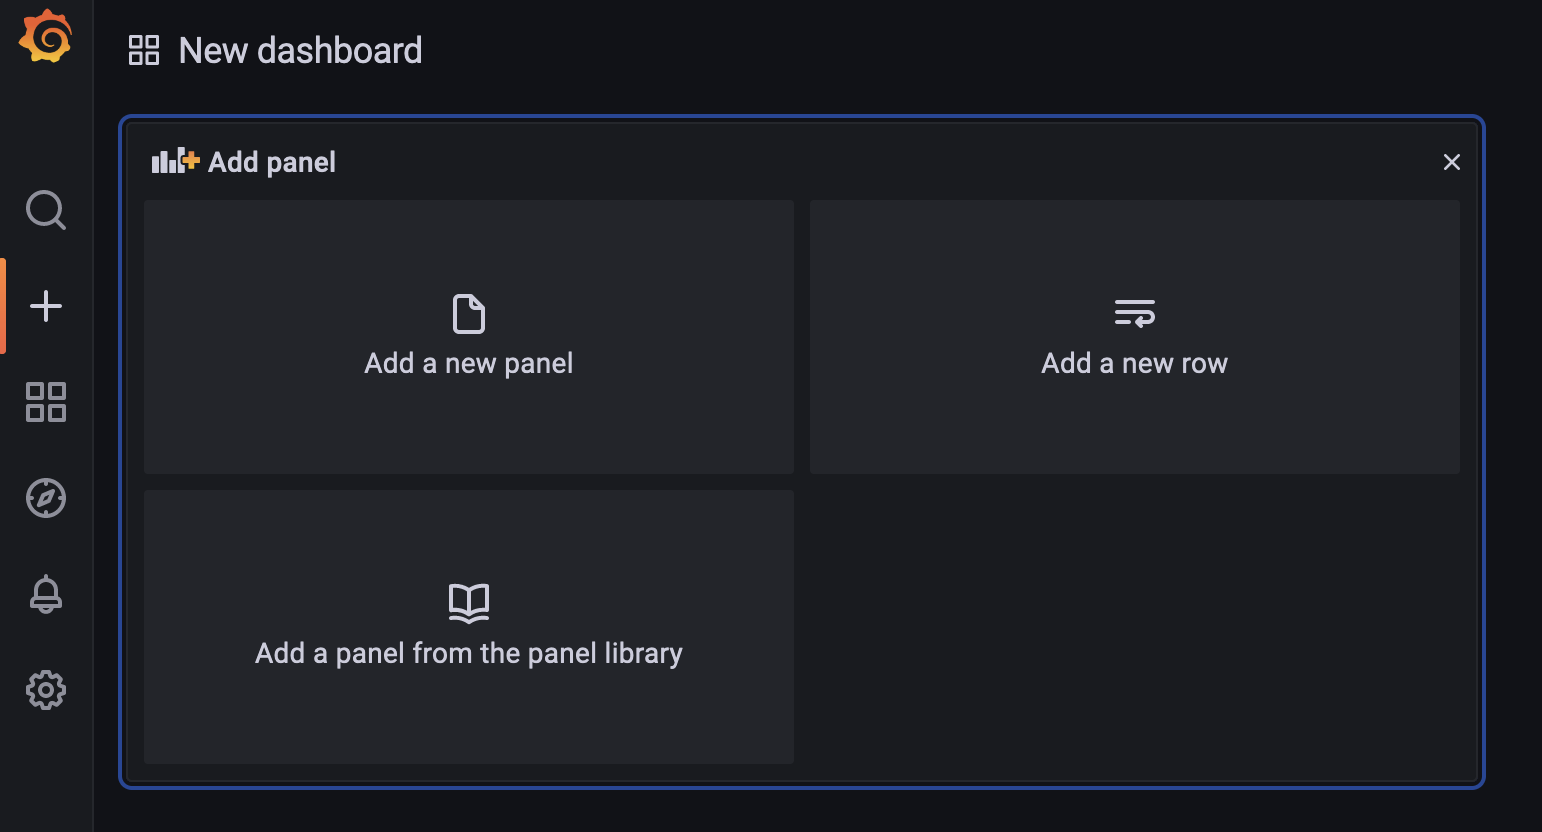
Go to Add New Dashboard:
And provide all the details about your PostgreSQL database:
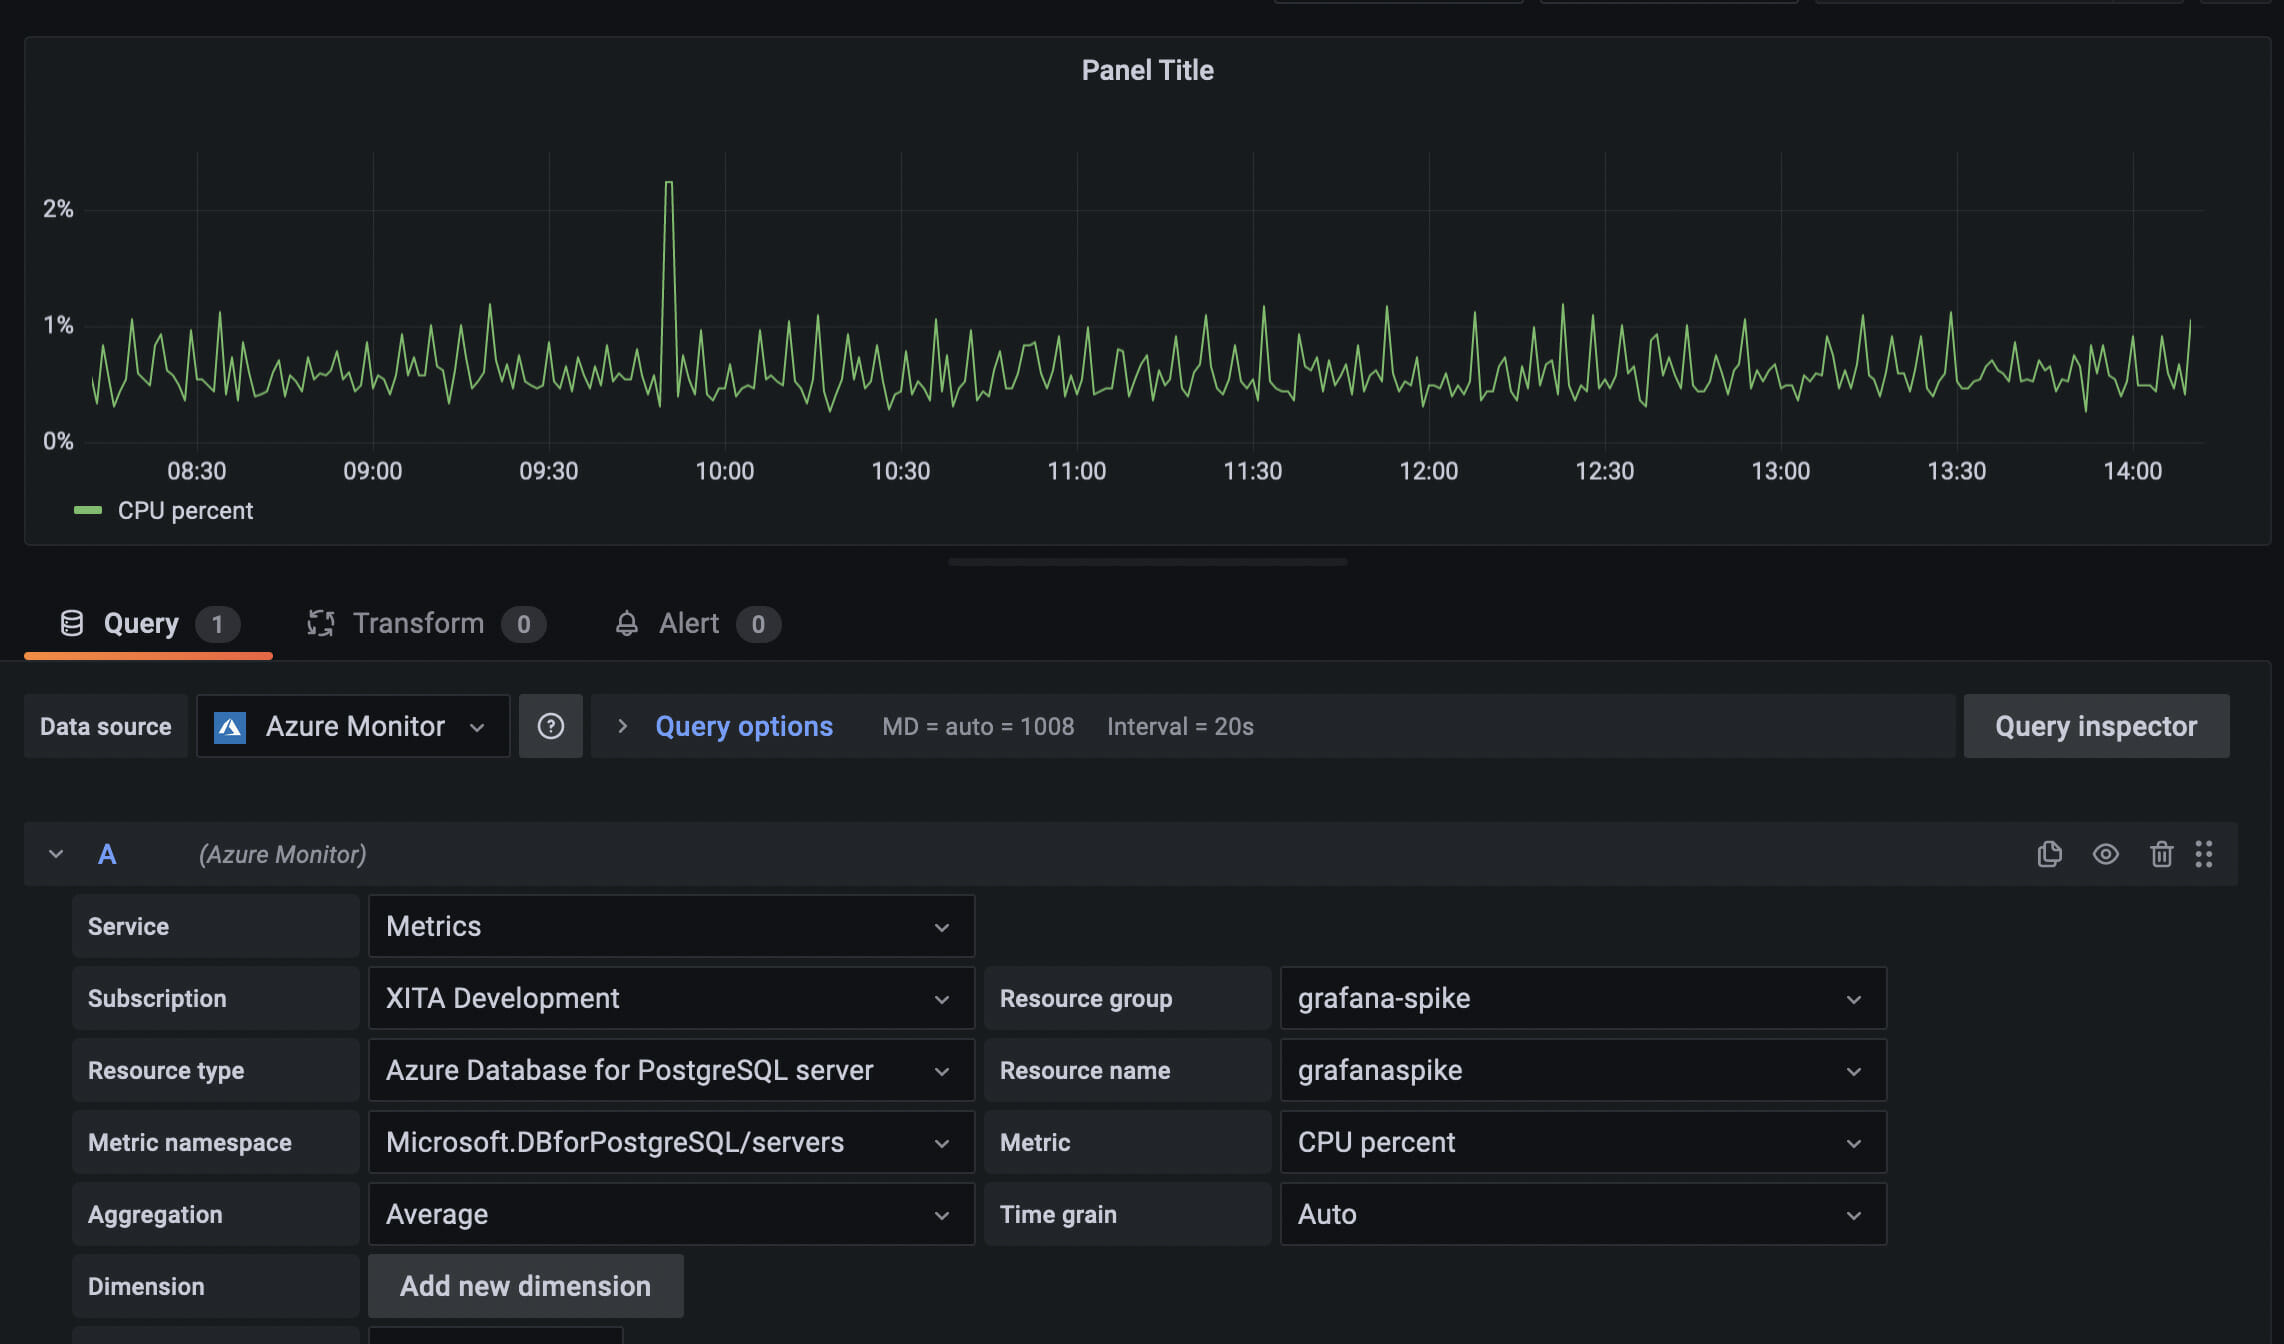
As you can see, we're able to read database CPU usage metrics using Grafana.
Conclusion
We've demonstrated how to use Grafana with Azure Monitor to boost your monitoring capabilities. Connecting your Application Service to Azure AD would allow for central and automated access management to Grafana.
Written by
Valerii Matveev


Contact