Blog
Centralized Monitoring for Data Pipelines: Combining Azure Data Factory Diagnostics with Databricks System Tables

Introduction
Monitoring data pipelines is essential for ensuring reliability, troubleshooting issues, and tracking performance over time. At Xebia, we frequently implement a data platform architecture that looks like this:
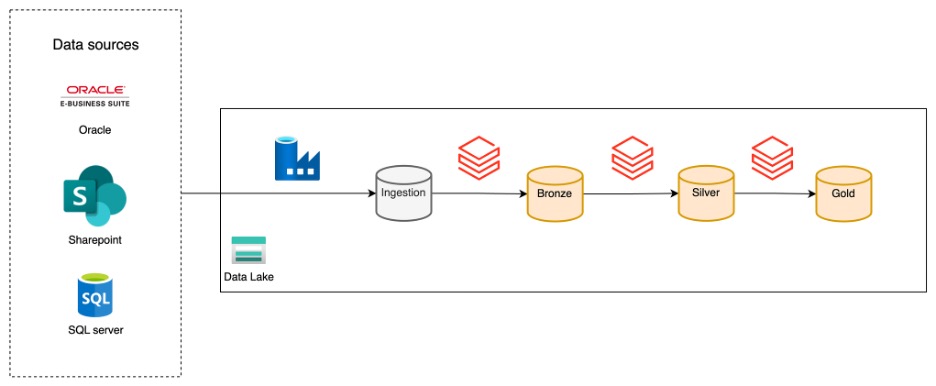
In this setup, Azure Data Factory (ADF) is responsible for ingesting data from a wide variety of sources into a storage account, while Databricks takes care of transforming that data and making it available for end users. This clear separation of concerns allows each tool to play to its strengths: ADF excels at connectivity and ingestion, while Databricks is powerful for transformation and analytics.
Despite these advantages, monitoring is often fragmented. ADF provides monitoring for individual pipeline runs, and Databricks offers workflow analysis through system tables, but there is no single place to get an end-to-end view of the data flow. This makes it difficult to track the full journey of the data and quickly identify issues.
This article demonstrates how to bridge that gap by combining ADF diagnostic settings with Databricks system tables. The example below shows how to create a centralized overview to analyze the amount of data ingested and the end-to-end runtime for a specific use case. However, the setup can be easily adjusted to your specific information needs.
Prerequisites
To follow along, ensure you have:
- An Azure Data Factory instance with running pipelines
- A Storage Account
- A Databricks workspace connected to the same Storage Account
- Databricks System Tables enabled
Azure Data Factory Diagnostic Settings
Azure Data Factory diagnostic settings allow exporting pipeline run logs and metrics to a storage account, Log Analytics, or Event Hub.
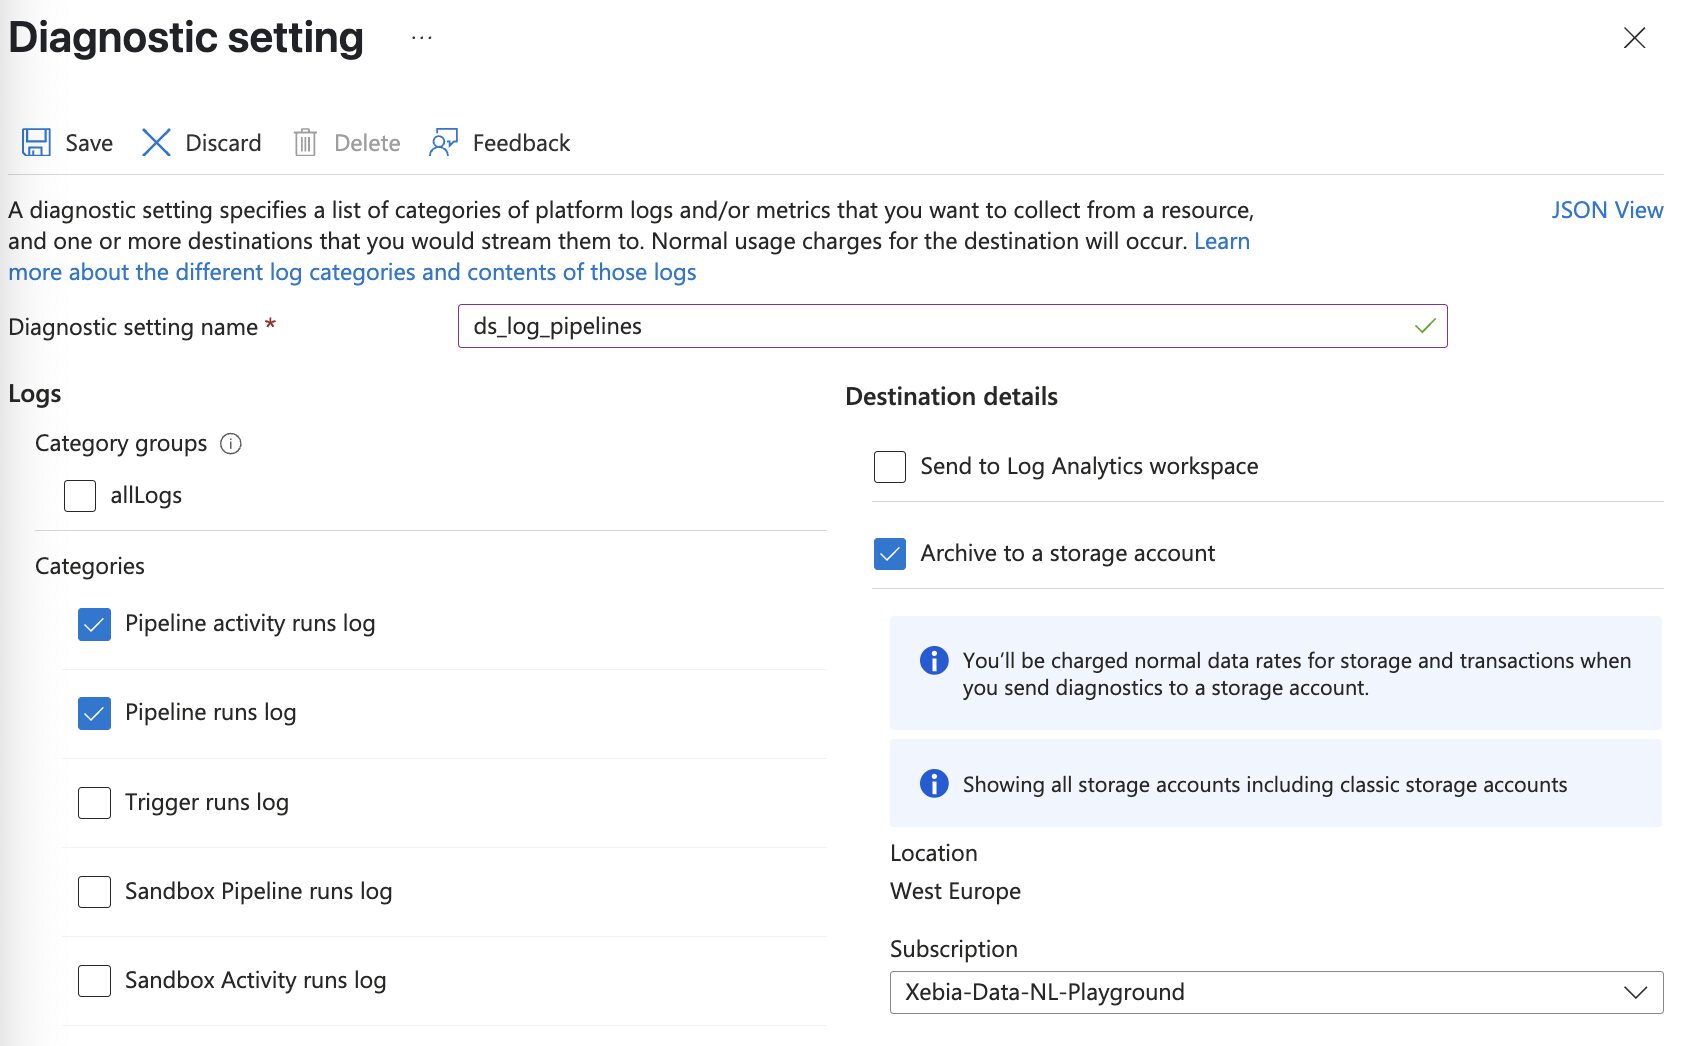
The first step is to export the diagnostic settings to a storage account accessible by Databricks. From the Azure Portal, go to your ADF instance, select Diagnostic settings, and add a new diagnostic setting. In the categories, select the ones of interest. For this example, export the pipeline runs and the activity runs.
Once enabled, ADF writes logs to your storage account. The log folder structure is decided by Azure and cannot be modified. ADF creates one container per category selected.
Note that it may take up to 15 minutes before the logs appear.
Ingesting ADF Logs into Databricks
To analyze ADF logs alongside Databricks workflow data, ingest the logs into Databricks. One of the ways to do this is by using the Autoloader functionality of Databricks. Autoloader automatically keeps track of unprocessed logs in the storage account and processes new log files each time the autoloader is triggered.
The steps to achieve this are:
- Identify the storage path: Locate the container and folder in your storage account where ADF writes the diagnostic logs.
- Configure Databricks Autoloader: Set up Autoloader to monitor the storage path for new log files.
- Create Workflow: Schedule the Autoloader in a workflow with the frequency in which you want to update the audit table.
Repeat these steps for every category of diagnostic settings selected in the previous step.
Here is a sample PySpark code snippet to ingest ADF logs using Autoloader:
# Define path variables
container = "insights-logs-pipelineruns"
storage_account = ""
subscription_id = ""
adf_resource_group = ""
adf_name = ""

# Define path
path = f"abfss://{container}@{storage_account}.dfs.core.windows.net/resourceId=/SUBSCRIPTIONS/{subscription_id}/RESOURCEGROUPS/{adf_resource_group.upper()}/PROVIDERS/MICROSOFT.DATAFACTORY/FACTORIES/{adf_name.upper()}/"
checkpoint_path = f"abfss://{container}@{storage_account}.dfs.core.windows.net/_checkpoints/"

# Write logs to etl_audit.adf_pipeline_runs
df = spark.readStream.format("cloudFiles")
  .option("cloudFiles.format", "json")
  .option("cloudFiles.schemaLocation", checkpoint_path)
  .option("cloudFiles.partitionColumns", "")
  .option("pathGlobFilter", "*.json")
  .option("cloudFiles.inferSchema", "true")
  .load(path)
  .writeStream
  .option("checkpointLocation", checkpoint_path)
  .trigger(availableNow=True)
  .option("mergeSchema", "true")
  .toTable(f"etl_audit.adf_pipeline_runs")
After these steps, query the logs from Databricks by selecting the data from the adf_pipeline_runs table.
Combining ADF Log Categories
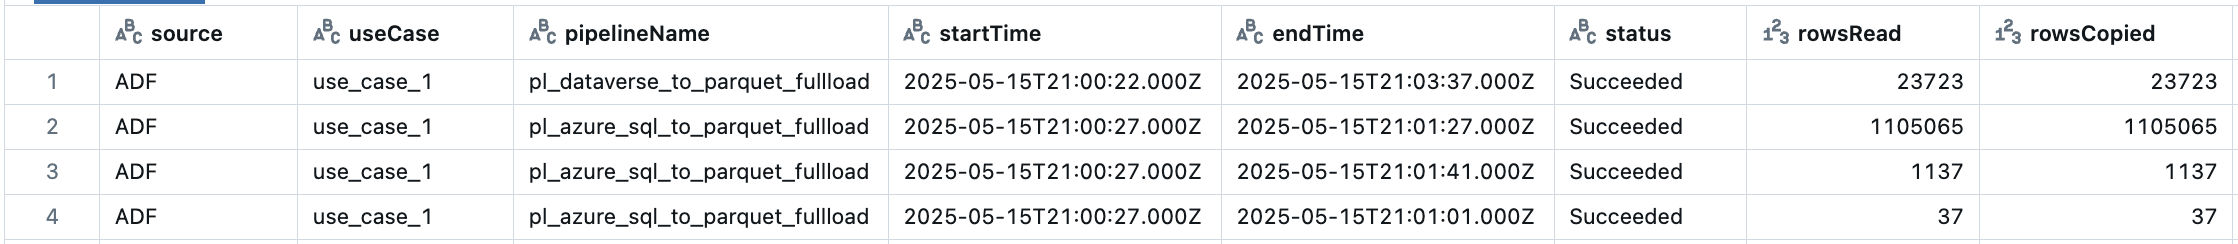
With the logs available in Databricks, the next step is to extract the information from the logs. For example, to see the amount of data ingested per use case, use the query below.
Note that this query is built for this specific information requirement, but you can include as much information in the audit table as needed.
-- Filter ADF pipeline runs for succeeded or failed operations
with adf_pipeline_filtered as (
  select
    runId,
    pipelineName,
    start as startTime,
    end as endTime,
    status,
    get_json_object(properties, '$.Annotations[1]') AS tableName, -- Extract table name from annotations
    get_json_object(properties, '$.Annotations[2]') AS useCase    -- Extract use case from annotations
  from
    etl_audit.adf_pipeline_runs
  where
    operationName ilike '%Succeeded'
    or operationName ilike '%Failed'
)

-- Filter ADF activity runs for succeeded or failed operations
, adf_activity_filtered as (
  select
    pipelineRunId,
    get_json_object(properties, '$.Output.rowsRead') AS rowsRead,     -- Extract rows read
    get_json_object(properties, '$.Output.rowsCopied') AS rowsCopied, -- Extract rows copied
    row_number() over (partition by pipelineRunId order by activityRetryCount desc) as rn -- Only take latest retry of copy activity
  from
    etl_audit.adf_activity_runs
  where
    operationName ilike '%Succeeded'
    or operationName ilike '%Failed'
)

-- Combine pipeline and activity data, joining on run ID and selecting only the latest retry of the an activity per pipeline run
, adf_combined as (
  select
    "ADF" as source,
    pf.useCase,
    pf.pipelineName,
    pf.startTime,
    pf.endTime,
    pf.status,
    af.rowsRead,
    af.rowsCopied,
    pf.tableName
  from
    adf_pipeline_filtered pf
    left join adf_activity_filtered af on pf.runId = af.pipelineRunId
  where
    af.rn = 1
)
Add Databricks System Tables
Databricks System Tables provide detailed information about workflow runs, job statuses, and more. Query these tables to extract the relevant details for your monitoring dashboard.
- Create a view to select the key columns (e.g., job ID, run status, start/end times)
- Join this view with the ADF logs view to create a centralized, end-to-end monitoring table
- Customize the final view to your organization’s needs (add columns, filters, etc.)
To get a complete view of the runtime for a use case, merge the ADF audit table with the Databricks System table using this query:
This query continues from the previous one, so you can simply append it to build a single, unified SQL statement.
-- Select Databricks jobs
, adb_job as (
  select
    *,
    row_number() over (partition by workspace_id, job_id order by change_time desc) as rn -- As this is an SCD2 table, we only take the most recent version of the job.
  from system.lakeflow.jobs
  qualify rn = 1
)

-- Select Databricks job run details
, adb_job_run as (
  select
    job_id,
    period_start_time as startTime,
    period_end_time as endTime,
    result_state as status -- Job run status (e.g., Succeeded, Failed)
  from system.lakeflow.job_run_timeline
)

-- Combine job and run info, align columns with ADF data
, adb_combined as (
  select
    "DATABRICKS" as source,
    coalesce(job.tags.use_case, null) as useCase,
    job.name as pipelineName,
    run.startTime,
    run.endTime,
    run.status,
    null as rowsRead,    -- Not applicable for Databricks jobs
    null as rowsCopied,  -- Not applicable for Databricks jobs
    null as tableName    -- Not applicable for Databricks jobs
  from adb_job job
  left join adb_job_run run on job.job_id = run.job_id
)

-- Union ADF and Databricks results for a centralized view
, combined as (
  select * from adf_combined
  union all
  select * from adb_combined
)

-- Final selection, ordered by most recent runs
select *
from combined
order by startTime desc
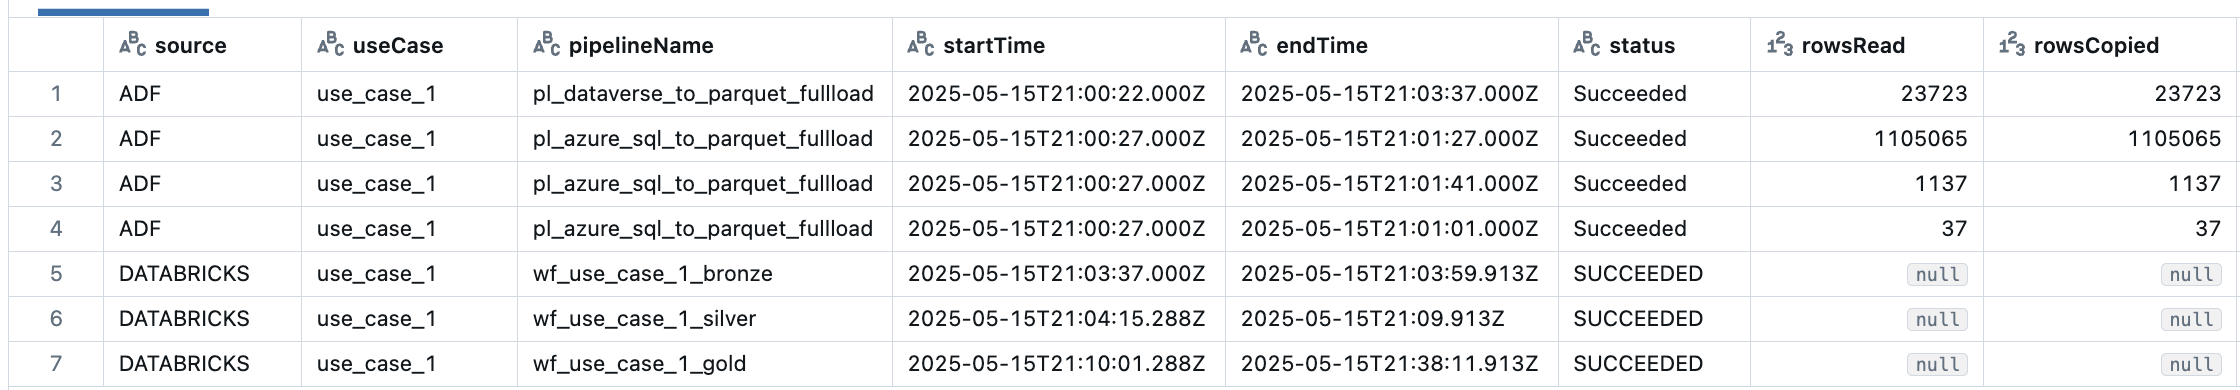
This produces a result in which you can easily see the data ingested and the end-to-end runtime of the use case.
Summary
In this article a solution is shown how to combine ADF Diagnostic settings with Databricks System tables for a centralized audit table giving you a single place to monitor and analyze your data pipelines.
With this setup, you can answer a wide range of questions and support many scenarios, such as:
- Analyze changes over time in rows loaded for a specific table or use case
- Track the total runtimes and performance trends of entire data pipelines
- Identify bottlenecks or failures across the full pipeline, from ingestion to transformation
- Correlate ingestion and transformation steps for better troubleshooting and root cause analysis
- Enable reporting based on custom metrics or thresholds
Limitations & Tips
- System Tables: Ensure system tables are enabled in your Databricks workspace (available in Premium and above).
- Log Volume: ADF diagnostic logs can grow quickly. Set up retention policies or lifecycle management on your storage account.
- Schema Changes: If your pipelines or workflows change structure, update your views accordingly to avoid missing data.
- Infrastructure as Code: You can set up ADF diagnostic settings via Terraform for automated, repeatable deployments.
- Data Visualization: Exposing the final audit table in a data visualization tool (or even a Databricks dashboard) makes it easy for non-technical stakeholders to see when to expect their data to be refreshed.
Written by
Rik Adegeest
Rik is a dedicated Data Engineer with a passion for applying data to solve complex problems and create scalable, reliable, and high-performing solutions. With a strong foundation in programming and a commitment to continuous improvement, Rik thrives on challenging projects that offer opportunities for optimization and innovation.


Contact