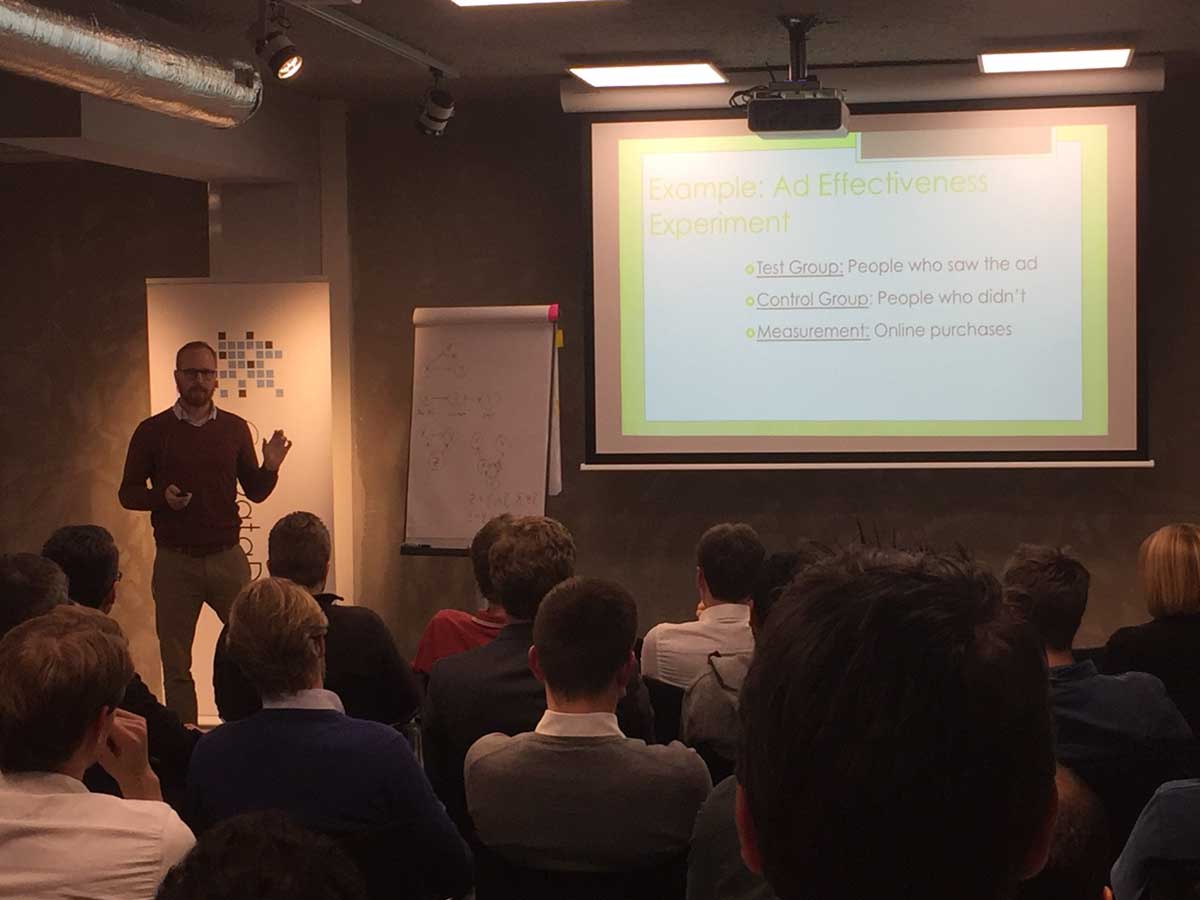
“There’s lots of value in data analytics. But when the low-hanging fruit in a dataset is gone, it becomes harder to extract value from the data.” It is tempting for organizations to find biased answers and draw faulty conclusions, like mixing causation with correlation. In a recent presentation at the Meetup Business Experimentation, Adam Kelleher, lead data scientist at Buzzfeed, emphasized that this is not without risk.
Adam Kelleher is lead data scientist at Buzzfeed, one of the highest traffic sites globally. He was in Amsterdam to give a workshop and a presentation on Causal Data Science at the GoDataDriven office.
Getting value from data without getting in trouble
First, Adam took us along some lines of thought about value and complexity.
- Value implies investment
- Investment implies growth
- Growth implies complexity
- Complexity implies trouble
How can you find value in data sets, without getting yourself in trouble? Adam explained this by going into causality versus correlation, focusing on the effect and not the treatment, avoiding bias, and drawing the right conclusions. Roen Roomberg attended the Meetup and was very excited: “The thing I learned most, is that using data is like using fire. Adam showed me how you can cook a great meal with it, but also how you can completely ruin your ingredients. He truly gave a Masterclass in data science”.

Causality vs. correlation
Correlation means that two or more situations often occur together. Causality means that one thing led to another. As easy as this may sound, determining causality is not trivial. Let’s take the example of a hot summer day. People tend to get sun burned (luckily less and less these days) and drink more water. So, you could say that sun burn and thirst are correlated. But is there causality? As easy as it may be to conclude yes, in fact it is not. The cause for both sun burn and the thirst is the sun. So, sun burn and thirst are correlated but without a causal link between them.
A correlated effect should not be confused with a causal relationship. Adam explains that this in statistics confounding means that something (a variable) is connected to at least two other variables and explains the correlation between the two other variables. Indeed, like the sun in relation to sunburn and thirst.
Focus on the effect and not on the treatment
Reason for explaining this is that in online experiments sometimes it is tempting to attribute a causal relation between two events, when they only correlate. Adam emphasizes the importance of adding random articles when recommending content on a website as part of A/B tests, so that recommendations are optimized based on the actual content that is recommended and not on the fact that recommended articles are shown.

Avoid Bias
Usually, data is only collected after a product is built. The data is then analyzed after the fact, resulting in observational data and no experimental data. This leads to bias. At Buzzfeed the data science team analyzed the length of headlines and the associated click-through rate (CTR). The outcome was that headlines with 16-18 words had the highest average CTR. The conclusion could be that the correlation between headline length and CTR is also a causal effect. Based on this analysis only this can’t be proven, so further experiments are necessary. "Yes, having an experiment would be great, but sometimes you just can’t have them. Adam’s workshop gave a nice conceptualization of the best use of your observational (non-experimental) data at hand”, says Taavi Kivisik after attending the presentation.
Attribution
Another challenge is to understand if a recommender creates extra traffic or simply facilitates it. When someone shops for shoes, this person might already be intending to purchase a belt. So, recommending the product didn’t cause the purchase but simply facilitated the intent. So, it did make the purchase easier.
When running an experiment, it can be easy to decide that one experiment is the clear winner. But if you apply proper statistics, you can’t say that this result is significant. Adam used an example where you have two ads, both have 10000 impressions, but the CTR of Creative 2 is twice as large as that of Creative 1. The conclusion here is that it is safe to say that with a 95% significance Creative 1 performs 100% better or 20% worse…
When the number of impressions doubles to 20,000, it becomes safe to say that Creative 1 will perform better. How much better is difficult to say, but with 95% confidence you can say that Creative 1 will perform 1% to 100% better than 2.
Not only should you make sure to take the right decision based on true causality but also on true significance.
The right expertise to solve hard data problems
Adam Kelleher explains that it is important to understand that it is relatively easy to extract value from new data sets but at some point, the easy problems are gone. For the hard problems, you need experts with the right expertise.
This means that organizations that are ready to explore the difficult problems should look for three things:
- Cross-disciplinary knowledge. Social science for causality, statisticians to apply good statistics and data manipulators to use the big data.
; - Infrastructure where you can measure every instrument;
- Culture engineered to solve hard problems. Because not only easy problems have value, the hard ones sure do too.


