What is Embedded Analytics?
Embedded analytics is a part of software that connects dashboards hosted by reporting tools directly into your web app or service. Then, integration between reporting tools and web apps can be made for aesthetic purposes - to hide specific controls and present only the most valuable content for users - or to add more functionality, features, or even security levels. This setup enables easier data analysis without the need to switch and log in between multiple applications. Embedded analytics is strongly connected with customer facing analytics - the practice of embedding data insights and visualizations directly into a product, platform, or service, allowing end-users (customers) to access, understand, and act upon their own data.
Benefits and Key Features
- The user receives a single interface to interact with the data.
- Embedding might be an additional panel with up-to-date insights about essential business processes.
- Can save cost for keeping all data insights on a single pane of glass, limiting the time needed to log into different applications.
- Embedding can scale up without using the main web application resources.
- An external web app can handle a security and logging layer, providing insights tailored to a particular user and their privileges.
- Additional functionalities can be implemented over the embedding, like custom content based on logged or narrowing and filtering the range of presented data (row level policy).
Methods of Embedded Analytics
There are many methods of how to embed the report into an app or website - we can choose from many features for different use cases.
The easiest way to embed a report is to paste a hyperlink within the iframe element in our app's HTML code. It is a fast and straightforward solution, but it often lacks authorization and authentication features, instead delegating these tasks to external BI tools, requiring users to log in twice.
For enhanced security and user identification, more advanced solutions are available. These include deploying specialized frontend libraries that embed user information directly into the reports. A detailed tutorial on this approach is provided in the subsequent chapter.
Embedded Report Example on Open Source Tech Stack (Python Flask Web Application + Superset BI tool)
Our goal is to embed reports accessible exclusively to web application users, with each user's access restricted to specific table rows. Please note that this is a simple example designed to demonstrate the mechanism and simulate the environment; it is not production-ready. Let's explain the technology stack chosen for this tutorial.
Why Apache Superset?
Superset was chosen for its open-source nature, eliminating vendor lock-in. Its ability to embed reports (via iframe), row/column level security, and flexibility in creating custom, personalized reports were crucial for integrating BI functionalities, ensuring data privacy, and providing tailored insights.
Why Python + Flask for the Frontend?
Python Flask was selected for the frontend primarily due to its ability to create a simple, mock UI that is efficient for our current needs. Flask's Python foundation is ideal for data projects, leveraging existing data science and data-engineering skills.
At first, on Superset, we must enable embedding for a particular dashboard and save its unique_id - this is also the moment when you can narrow access to a custom domain, e.g., the domain of your web app - then you know that the report can be accessed only via your web app.
Clicking on the… button next to EDIT DASHBOARD on the top right of the dashboard's overview page should yield a drop-down menu including the entry "Embed dashboard".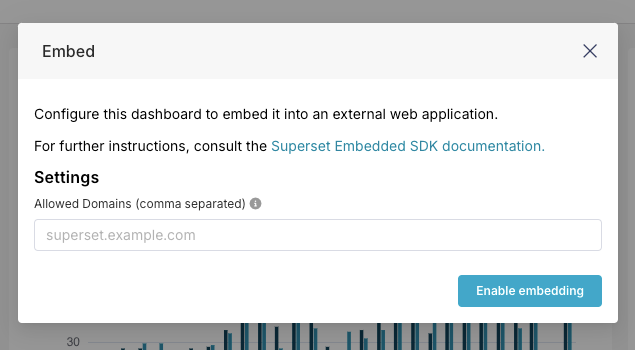
After "Enable embedding" is clicked, the dashboard_id will appear, and the scope of allowed domains for the embedded dashboard can be narrowed.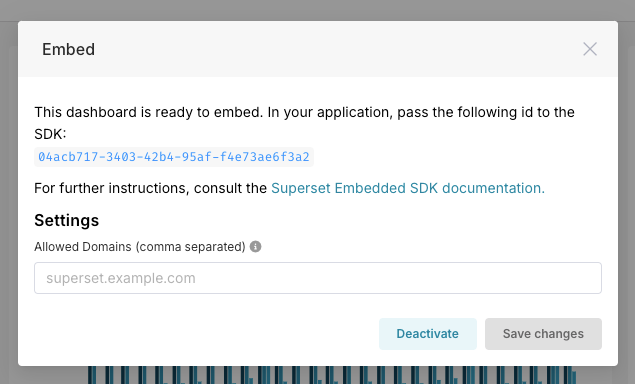
Some logic needs to be coded for web application functionalities.
On the frontend side, add the Superset SDK to the HTML part and implement the `fetchGuestTokenFromBackend()` function, which will call the backend endpoint /get_guest_token.
On the backend side, implement functions: `get_access_token()` to authenticate a web app to Superset by application credentials and `get_guest_token()` to request a guest token from the Superset instance.
Subsequently, the frontend SDK will manage a guest token, facilitating the presentation of data on the embedded report. This report will identify the user's name and corresponding row-level policy, ensuring only relevant data is displayed.
The diagram below illustrates the secured authentication workflow. Authentication between the application and Superset occurs on a layer hidden from the frontend user. The frontend calls a backend endpoint, which then connects with the Superset instance.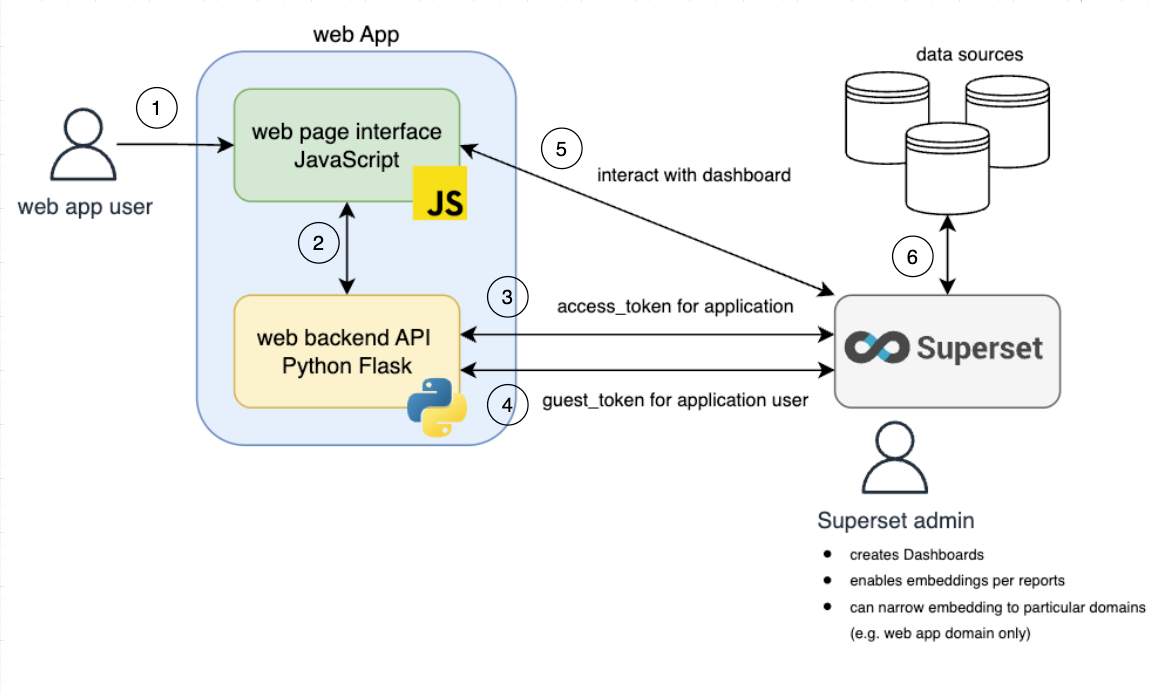
Here's how the application embedding logic works:
- A user logs into the web application.
- The web application stores a mapping of the user's ID to their row-level security (RLS) policy for each dashboard.
- The web application authorizes with Superset, obtaining an `access_token` for the application user.
- Using this `access_token`, the web application requests a `guest_token` for the specific `user_id`, applying its `rls` to the target `dashboard`.
- The received `guest_token` grants the logged-in user access to the embedded report, but only within the limited scope of the target `dashboard` and its specific `rls`.
It is important to note that Superset currently has some limitations. Guest tokens can only be requested without setting up custom roles. While users are detected and identified within Superset, there are not many actions that can be performed with this information. Although the manual states that usernames can be displayed on dashboards or used in data-fetching queries, a more straightforward approach to achieve the same functionality is through row-level security.
To maintain the simplicity of this tutorial, we have omitted the prerequisites for app deployment and additional security features. Please refer to the Flask and Superset manuals for guidance on these aspects.
Comparing Features and Pricing of Embedded Analytics Tools (June 2025)
Free Solutions:
- Superset: A free, open-source tool with extensive features. However, it lacks native multi-tenancy, requiring custom row-level security rules for each client workspace.
- Looker Studio: A free tool within the Google Cloud ecosystem. It supports embedding via URL or iframe, with options to restrict access to embedded reports.
Paid Solutions:
- Microsoft Power BI: This solution operates on a pay-as-you-go model, with pricing dependent on virtual core and memory usage, making it difficult to predict. It offers strong integration with the Microsoft ecosystem (Azure, Office, Azure Active Directory) and is a major player in the market with numerous features.
- Tableau: Priced at $75 per creator and $15 per viewer account, per month, billed annually. It provides clear documentation for embedded analytics and offers a guest user feature for accessing embedded dashboards, similar to Superset.
- Looker: Pricing is not transparent and requires direct contact with sales. It is well-documented and supports signed embedding with various authentication methods.
- Preset: A managed service for Apache Superset, simplifying deployment and maintenance. It costs $20-$25 per month per user, billed annually or monthly. No additional embedding features were observed.
- GoodData: Pricing is not transparent and requires direct contact with sales. It offers a well-documented embedding process with features like iframe, web components, or React SDK embedding. Authentication can be automatic with OpenID Connect (OIDC) or manual with API tokens. It also includes an Embedded Dashboard Editor and numerous integrations and features.
- Luzmo: Priced at 995 Euro per month for 100 readers and one designer account. A higher subscription plan (3100 Euro per month for 1000 users and 30 designer accounts) includes an embedded dashboard editor. This product is primarily focused on Embedded Analytics and utilizes web components for embedding, offering a more native and performant integration than iframes. It also features Luzmo IQ, providing embeddable AI insights for end-users for advanced analysis.
This article explored the concept of Embedded Analytics, explaining how it bridges the gap between data and users by providing customized, user-friendly embedded dashboards. We hope the comparison of various available tools assists you in selecting the ideal solution, whether you require an enterprise-grade platform for large-scale operations or a straightforward, free, open-source product with fundamental features. We hope this brief tutorial provided helpful insights into customizing your implementation.
Written by
Adam Wisniewski
Contact