Blog
Secure by Default, Slow by Surprise
What AWS Forgot to Mention About RDS IAM Authentication

Throughout my career as a backend and cloud engineer, I have worked with several database management systems. And while each of them has its own protocol, data management, and administration procedures, one thing always remains: access credential management.
Let's be honest: creating a database user and granting it the required privileges is only half the work. Once the user is created, the engineers need the password to work with the database. Following the Twelve Factor App principle, plaintext credentials are kept out of your application code. It doesn't change much whether it's an environment variable or a full configuration file; it is still a secret to manage: someone has to provision it, regularly rotate or build a Lambda function to do this. And, once leaked, the secret is valid until the next rotation cycle.
RDS IAM Authentication to the Rescue... Mostly
Amazon RDS IAM authentication promises to eliminate the secret entirely - the "password" is a short-lived token with a 15-minute TTL, generated on-demand and tied to an IAM identity that your cloud platform already manages.
From an operational standpoint, it's an attractive trade. You swap credential lifecycle management for IAM policy management — something your team likely already does everywhere else in AWS.
If you've already moved your database credentials into Secrets Manager, you've solved the hardcoded-credentials problem. IAM authentication is the next logical step - trade a managed secret for a managed identity. No rotation lambdas, no credential leakage window longer than 15 minutes. It fits neatly into how modern AWS infrastructure thinks about access.
Working with legacy databases, often used by workloads beyond your control, prevents the team from eliminating secrets management entirely. However, for applications you can modify or even build from scratch, the trade sounds clear.
We made it. Then we looked at our p99 request latency.
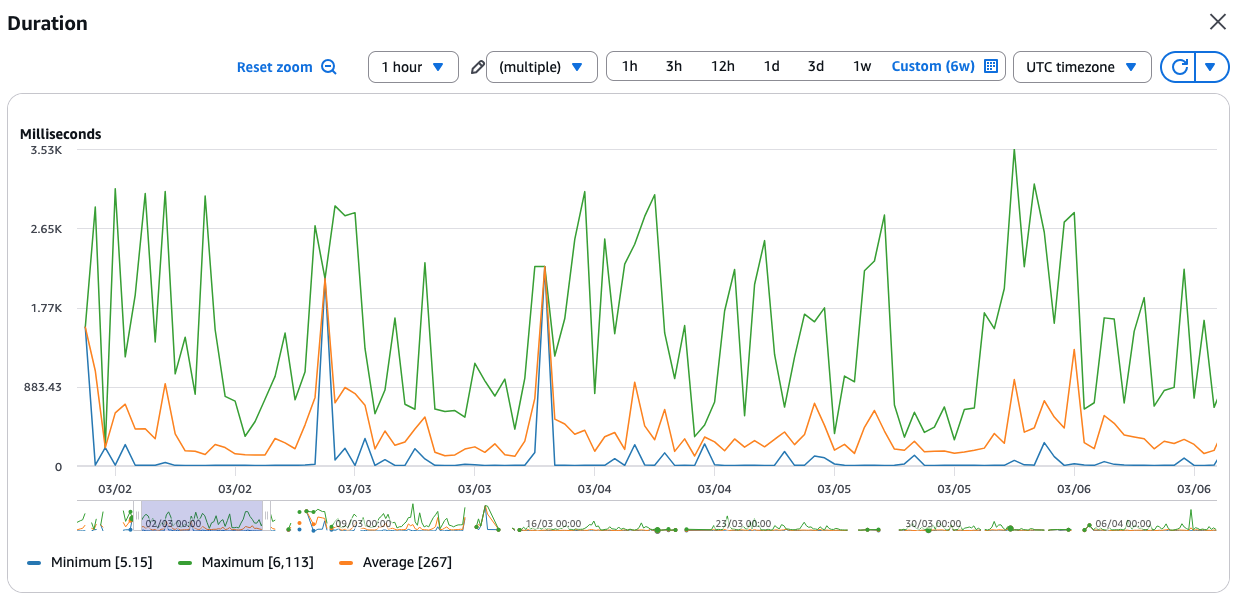 The first reaction, obviously, was to check whether we overlooked a suboptimal query or whether all the indexes are in place. But our database was just coasting:
 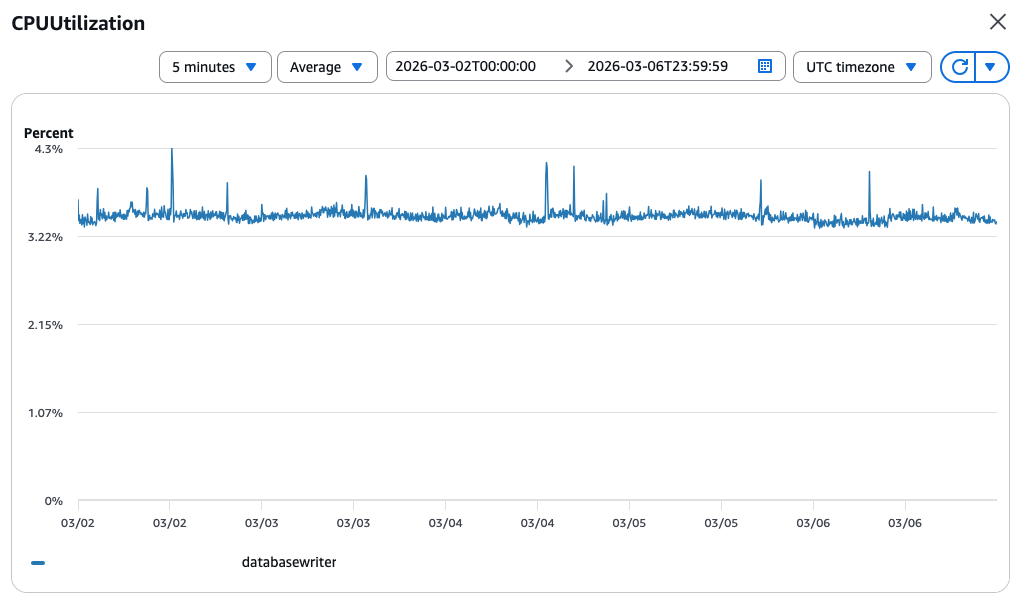 For the record, the database configuration:
- Amazon Aurora Serverless (v2) PostgreSQL v16.8
- Minimum ACU - 2
- Maximum ACU - 8
The same latency was easy to reproduce in the Development and Staging environments. So, to eliminate any rogue dependencies and Lambda cold starts, I deployed an EC2 instance and went down to the bare command line and psql. Good old days :)
The Rescue Team Was... Delayed
Every EC2 instance comes with the AWS CLI preinstalled. It is also a good practice to create an IAM instance profile. To grant connection privileges with RDS IAM Authentication, one has to add the following policy statement:
{
    "Action": "rds-db:connect",
    "Resource": "arn:aws:rds-db:<REGION>:<ACCOUNT>:dbuser:<DB_CLUSTER_ID>/<DB_USERNAME>",
    "Effect": "Allow"
}
Yes, your DBA/DevOps has to create a password-less database user first and grant an rds_iam to it. Once the user and the policy are there, we can get a token:
export PGPASSWORD=$(aws rds generate-db-auth-token \
 --hostname $PGHOST \
 --port $PGPORT \
 --username $PGUSER \
 --region $AWS_REGION \
)
The PG* environment variables are convenient as they are automatically read by the psql utility, so you don't have to pass them again. It's time to see what's wrong, three, two, one:
$ time psql -c 'SELECT 1'
 ?column?
----------
        1
(1 row)


real 0m6.148s
user 0m0.006s
sys 0m0.006s
Wait... Again...
$ time psql -c 'SELECT 1'
?column?
----------
1
(1 row)
real 0m0.119s
user 0m0.000s
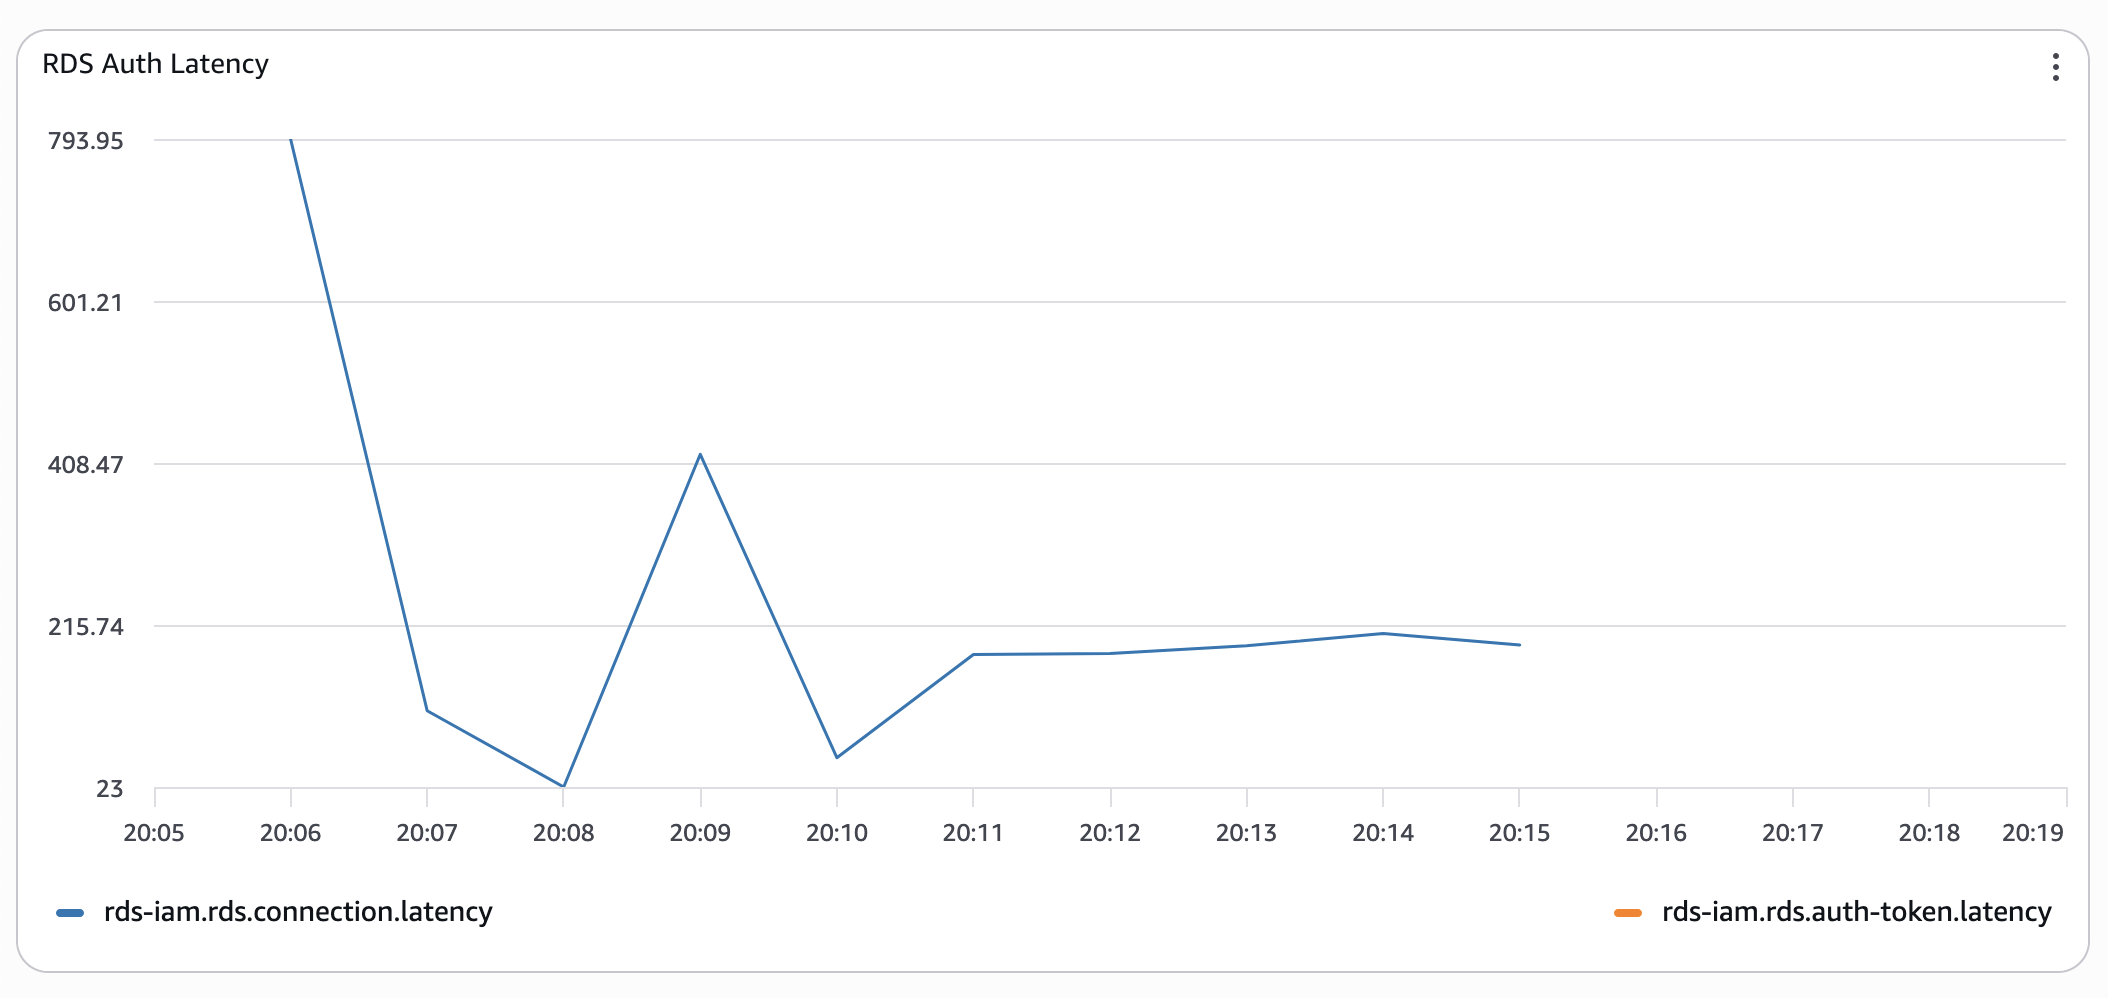
sys 0m0.012sI headed to the database monitoring dashboard, looking for an explanation. The graphs were calm, just like the CPU utilisation above. Until I found this graph on the third page. Numbers were boring, the pattern, though, resembled the function duration:  A few minutes had passed while I was looking at the graphs. I switched back to the EC2 console and ran the command one more time:
$ date
Mon Mar 9 14:11:29 UTC 2026

$ time psql -c 'SELECT 1'
 ?column?
----------
        1
(1 row)


real 0m3.940s
user 0m0.015s
sys 0m0.000s
Serverless Aurora: Paying the IAM Tax in Full
Before switching to Serverless Aurora to improve the import time of the legacy dataset, we used a provisioned database instance. And I could not remember ever having experienced such high connection times.
Our users were not that vigilant because, for them, the thing simply worked - you get your response, it just takes time. What helped to conceal the issue even more were Lambda functions' timeouts - the infamous default 30 seconds. So, the API handlers simply never timed out.
So, I changed the database instance type from Serverless to a resource-wise similar db.t4g.medium, a general-purpose instance type with 2 vCPUs and 4GB of memory, which is roughly equal to 2 ACU. The result was surprising:
$ time psql -c 'SELECT 1'
 ?column?
----------
        1
(1 row)


real 0m1.597s
user 0m0.013s
sys 0m0.000s
Everything else was the same:
- The same EC2 instance.
- RDS auth token was generated the same way.
- In both cases, no explicit
ssl-modehints, which could have slowed downpsqlwith certificate verification.
I spent about an hour switching instance types and running the same tests: the results were similar, with minor deviations for "cold" and "hot" connection attempts. At this point, I decided I might be missing something, because it cannot be just me with such results. So, we submitted a support ticket to AWS, thinking we must have encountered service degradation or even a bug in the authentication plugin.
For some reason, I felt that I needed more plausible evidence rather than timing the psql utility. So, I decided to gather it.
Bring the Stopwatch
Even though I knew the results would look similar, I proceeded to build a small test lab with:
- One Amazon Aurora Serverless Instance with a minimum capacity of 2 ACUs.
- One Python-based Lambda function fully instrumented with
- Lambda Performance Insights.
- OpenTelemetry metrics sent to CloudWatch Application Signals.
- One HTTP API Gateway exposing a single
GETendpoint backed by the Lambda function.
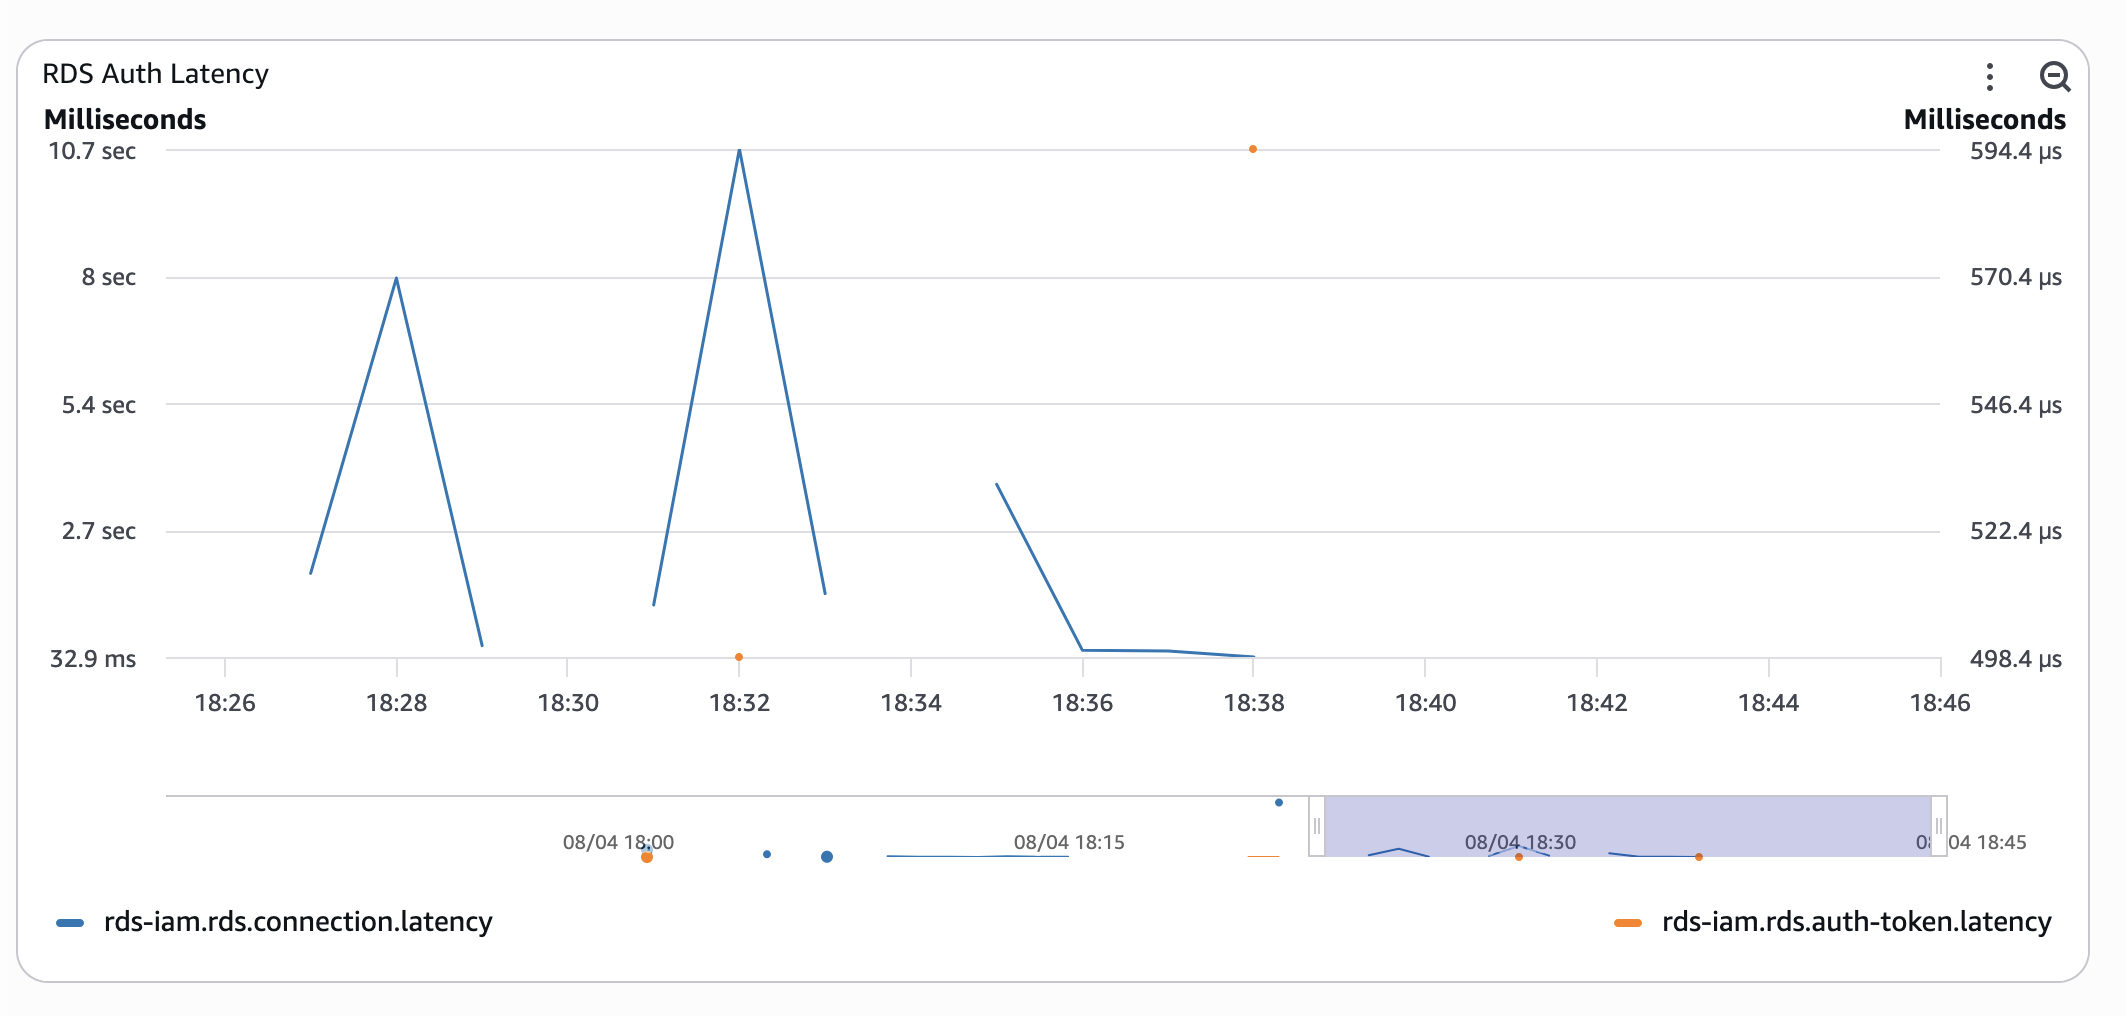
AWS Distro for OpenTelemetry Lambda helps with the heavy lifting. All I had to do was to instrument my own code. So, the API handler code got 2 histogram meters to record the time to acquire the RDS IAM token and to establish a database connection:
from aws_lambda_powertools import Logger
from opentelemetry import metrics

logger = Logger()
meter = metrics.get_meter(__name__)
rds_connection_latency = meter.create_histogram(
    name="rds-iam.rds.connection.latency",
    description="Measures latency time to establish a new RDS connection",
    unit="ms",
)
rds_token_latency = meter.create_histogram(
    name="rds-iam.rds.auth-token.latency",
    description="Measures latency time to generate a new RDS auth token",
    unit="ms",
)
I decided to test connection latencies for classic username-password authentication as well. Yes, that one that RDS IAM authentication should have relieved us from. So, I added a feature flag to quickly switch from one authentication type to another in the get_db_connection_string function:
import boto3

rds_client = boto3.client("rds")
secrets_manager = boto3.client("secretsmanager")

_db_token: dict = {"acquired_at": 0, "value": None}
_token_ttl = 14 * 60

def _get_db_auth_token() -> str:
    """
    Lazy fetch of IAM authentication token

    The function fetches a new token at first call,
    or if the existing token's TTL has expired.
    """
    global _db_token, _token_ttl
    logger.debug("Using RDS IAM auth")

    t = time.time()
    token_age = t - _db_token["acquired_at"]

    if token_age >= _token_ttl:
        start_ns = time.time_ns()
        _db_token = {
            "acquired_at": t,
            "value": rds_client.generate_db_auth_token(
                os.environ["PGHOST"],
                int(os.environ["PGPORT"]),
                os.environ["PGUSER"]
            ),
        }
        end_ns = time.time_ns()
        token_time_ms = (end_ns - start_ns) / 1_000_000
        rds_token_latency.record(token_time_ms)
        logger.debug("Got RDS IAM token", extra={"token_ms": token_time_ms})

    return _db_token["value"]


_password = None


def _get_pwd_from_secret() -> str:
    """
    Lazy fetch of RDS password from Secrets Manager.
    """
    global _password

    logger.debug("Using RDS credentials secret")
    if _password is None:
        start_ns = time.time_ns()
        secret = secrets_manager.get_secret_value(SecretId="rds-cluster-user")
        end_ns = time.time_ns()
        rds_token_latency.record((end_ns - start_ns) / 1_000_000)
        _password = json.loads(secret["SecretString"])["password"]

    return _password


def get_db_connection_string() -> str:
    """
    Returns DB connection string for psycopg
    """

    use_rds_token = int(os.environ["USE_RDS_TOKEN"])
    password = _get_db_auth_token() if use_rds_token else _get_pwd_from_secret()

    return " ".join(
        [
            f"host={os.environ['PGHOST']}",
            f"port={os.environ['PGPORT']}",
            f"dbname={os.environ['PGDATABASE']}",
            f"user={os.environ['PGUSER']}",
            f"password={password}",
        ]
    )
At last, to wire this all up, I used psycopg connection pools to create multiple connections within the same Lambda function runtime. Why not just a connection, but a pool? Well:
- One request spans one Lambda.
- One Lambda gets one RDS auth token and opens one connection.
- The connection is reused throughout the whole runtime lifecycle.
- Plus, connection pools provide connection statistics.
This means that once I start my load test, Lambda will spawn X concurrent instances with X open connections. And these database connections would be used throughout the whole test. Effectively, this will give me only X latency data points at the start of the test. My idea was to measure connection latency with the RDS auth token, which Aurora had already "seen". Just to check if it makes any difference.
So, I have set the connection's max_lifetime to 3 minutes and "opened" the pool synchronously to get the "cold" connection timings:
pool = None
prev_conn_time = 0

def get_pool():
    """
    Returns a psycopg connection pool.

    If no pool exists, create a new one and return it.
    """
    global pool, prev_conn_time

    if pool is None:
        pool = ConnectionPool(
            get_db_connection_string,
            min_size=1,
            max_size=5,
            # maximal lifetime of a single connection
            max_lifetime=180,
            open=False,
        )
        pool.open(wait=True)

        # record connection statistic
        cold_start_ms = pool.get_stats()["connections_ms"]
        rds_connection_latency.record(cold_start_ms)
        prev_conn_time = cold_start_ms

    return pool


def handler(event, ctx):
    """ """
    global prev_conn_time

    p = get_pool()
    with p.connection() as cnt:
        cnt.execute("SELECT 1")

    conn_ms = p.get_stats()["connections_ms"]
    # connection statistic is cumulative, we need delta
    if prev_conn_time < conn_ms:
        rds_connection_latency.record(conn_ms - prev_conn_time)
        prev_conn_time = conn_ms

    return {"body": "Hello there"}
An attentive reader would have shouted:
Ha, rookie mistake!
The RDS token and connection pool should be initialised outside the function handler.
And they would be right, but partially.
Cold start pothole
The thing is, the Lambda function's cold start, also known as the Init stage, is now billed. Some time ago, one could shave off some costs by initialising heavy resources, such as secret retrieval and database connections, before the function handler declaration. However, this is no longer the case, as the Init time function is billed to the customer.
During the experiment, I discovered another downside of this approach. The Init stage is not reported as the function's duration. Yes, it is reported to the function's log group, but it's not reported as the Duration metric on the monitoring dashboard.
So, what? Well, if you monitor your functions' duration, or even set an alarm to be on top of it, just remember that cold starts are excluded from that metric. But you still pay for them.
First Contestant
From here, I ran a performance test with siege:
siege -t 15M https://$API_GATEWAY_URL
And it yielded the following results:
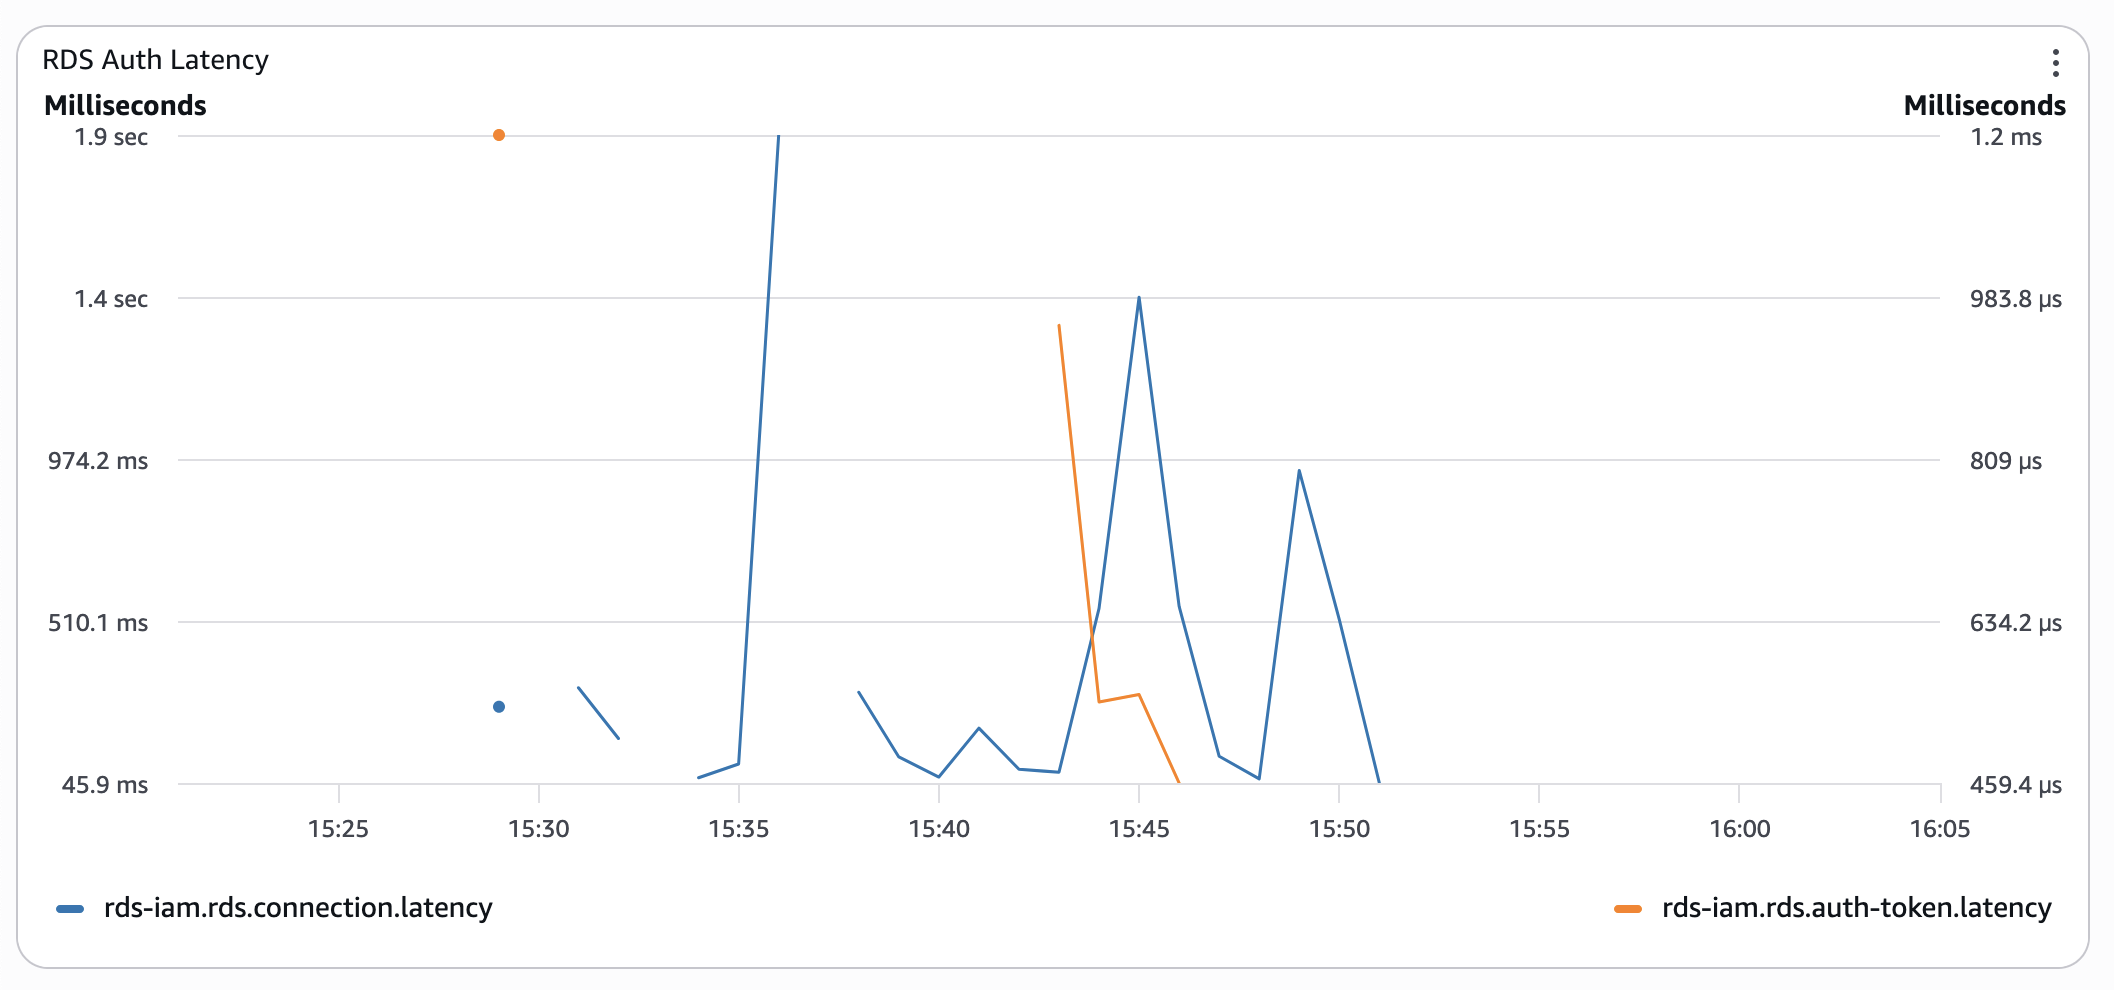
- Serverless Aurora with RDS IAM Authentication
- Serverless Aurora with classic username and password.
 Timings are still wonky, but already 10 times better.
I ran the same test several times, either triggering functions to redeploy or simply letting them cool down - the results were similar: "cold" connections with RDS IAM auth are horrendously slow. Pre-warming the connection pool significantly improved the situation.
Next, please
For the next round, I replaced a Serverless RDS instance (minimal capacity of 2 ACU) with a provisioned db.t4g.medium.
The T-class of instances is a so-called "burstable" class: instances earn CPU credits when their load is low and burn them when it spikes. This could have worsened the experiment's results, because the instance starts with a 0 credit balance. But, not a chance:
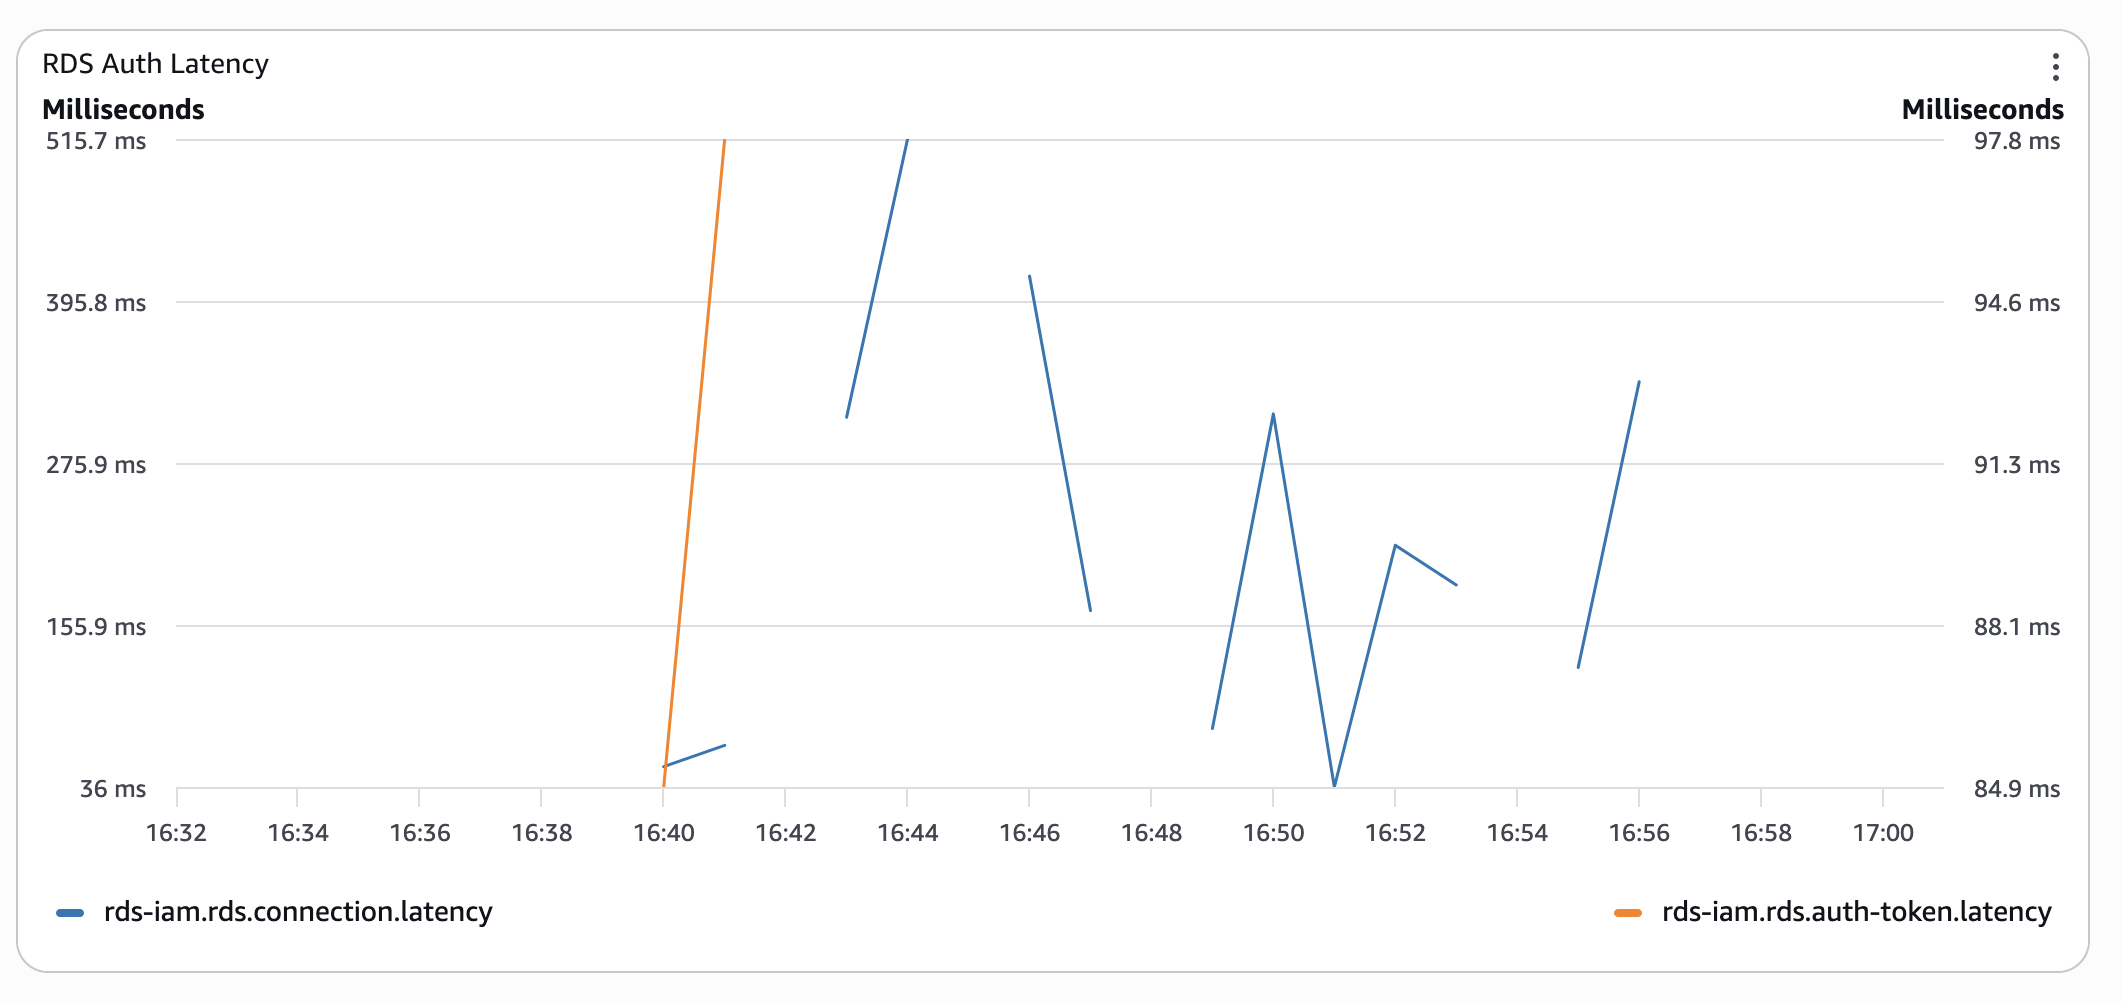
- Provisioned Aurora instance with RDS IAM Auth:
 Even without CPU credits, connection latency is 3 times lower than with serverless Aurora in the worst cases.
 - Provisioned Aurora with classic authentication:
 At this stage, a low CPU credit balance started to bite back. So, I gave it some time and re-ran the test the next morning:
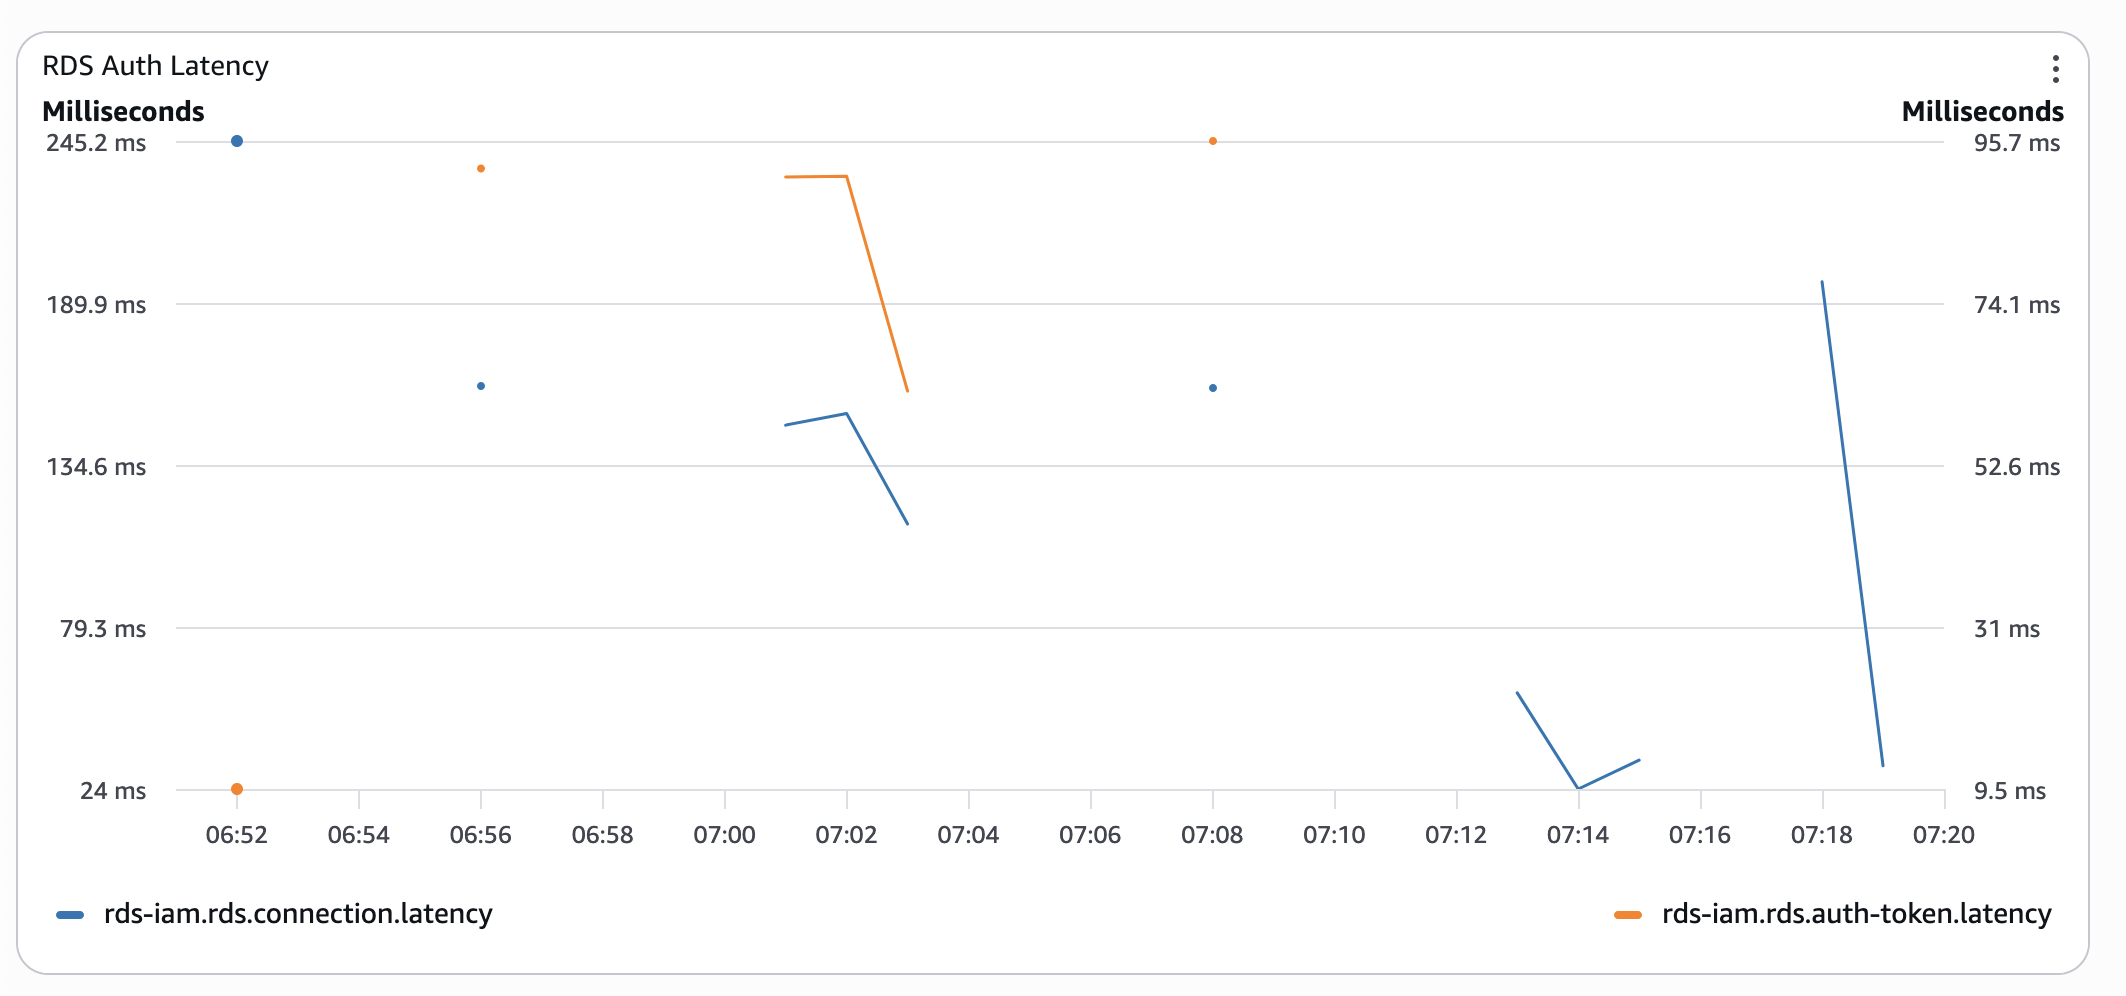
Was I surprised? No, I already knew this from psql timings. Was it worth the effort? Yes, I have got all these metrics, so I could get these pretty graphs 🤓
You have got mail
Do you remember the support case we submitted? Well, I hoped for a different outcome than it brought. Imagine my surprise when, after more than a week of messaging back and forth, running other tests following support engineers' advice, and after a case being escalated to RDS and IAM service teams, we received the following reply:
1. Aurora Serverless clears memory when scaling in and out (swapping out), which can affect connection latency as observed.
2. The same can be observed while using RDS Proxy and Serverless Aurora instance, though the impact is smaller.
3. Provisioned instances show improved performance on both the cluster endpoint and the RDS Proxy endpoint as the instance does not swap out.
The engineering team has advised that increasing the minACU can improve the connection latencies; however, there is no guarantee that instances/clusters with high minACU will not be swapped out.
Yes, all database connections come at a cost. But I refuse to believe the cost is several seconds of latency. Did we get any recommendations? Of course, in a nutshell, to throw more money at the problem:
1. For latency-sensitive workloads, provisioned instances perform better, though they come at a cost.
This reads nothing more than "Pick your own poison" - a higher bill for your database, or for your compute.
2. RDS Proxy improves the connection latency whether used with Provisioned instances or Serverless.
The proxy indeed improved connection latency by simply hiding it from your workload. I ran the test too. The very first connections had the same horrendous latencies. After your proxy is warm enough, we get sub-100ms latencies. Yay! Plus, we now have another service to pay for!
The closing paragraph was nothing more than the infamous "thank you for your time and help, we've noted all down".
Based on our investigation, this behaviour is consistent with Aurora Serverless architecture and scaling operations.
The engineering team has documented these findings to help inform future product enhancements around connection performance optimisation.
Wrap Up
Since all our migration activities were complete and the usage pattern was predictable, we swapped our Serverless Aurora for a good-old provisioned instance, as the first step. Only this cut our average request duration in half. Cold starts could still take 1-2 seconds, but spikes of 4+ seconds were completely gone.
While digging through the docs, I found two more reasons to think twice:
- Custom Route 53 DNS records instead of cluster endpoints - forget about it;
generate-db-auth-tokenaccepts only the latter.
So, if you want to have human-friendlyrds.<YOUR_DOMAIN>.internalfor automatic switch-over to another cluster if something goes wrong, RDS IAM auth is not for you. - RDS Auth token generations are not logged in either CloudWatch or CloudTrail. So, getting any metrics and setting alarms is impossible.
Yes, managing database users and their credentials is an exercise in itself. And, RDS IAM authentication looks very appealing. If you're evaluating it, now you have the numbers. Make the trade with eyes open.
Photo by Michael Anthony.
Written by
Yev Dytyniuk
AWS Cloud Consultant/Engineer
A software/cloud engineer who has seen enough to go and fix things before the damage is done. I've built various web applications, integrated enterprise systems, run migrations, etc. I like simple, effective, and robust architectures and am always on the lookout for another interesting challenge: optimise a wonky database, turn an hour-long batch process into a blazingly fast event-based pipeline, or just talk about the quirks of another AWS service.
Our Ideas
Explore More Blogs


Contact