Monitoring and alerting keeps on to be a part of our IT solutions that has enormous value and always is lacking in development. In this blog, a summary of the Monitoring levels and Monitoring Maturity that can be used to assess your situation and determine which user stories are needed to improve your observability.
Improving your monitoring capability will improve your resilience, reliability, your development speed, your DORA maturity, your CI/ CD maturity and improve your maturity in Secure Software Development Lifecycle (SSDLC).
Monitoring in context – sensemaking
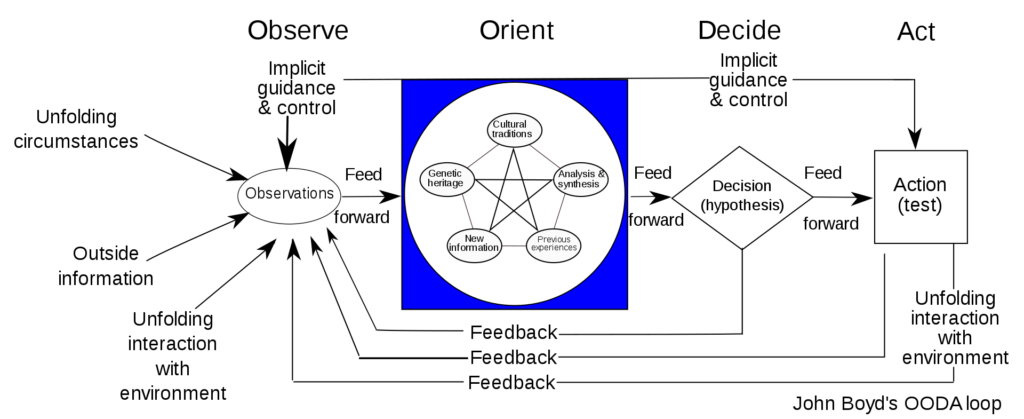
The two most famous sense making and improvement frameworks are the Deming Circle of Plan, Do, Check, Act and the OODA loop of Observe, Orient, Decide and Act. Both frameworks rely on information obtained by the observation of the actor (you). This is what we call monitoring. Monitoring is the capability to retrieve data (logging), and transform this data into information and events.

Diagram of the OODA loop from wikipedia
The Art of Logging
Logging data in IT systems can be done via (1) exposed into log files, (2) log data sent to a network service. Common is that an IT system is generating logs. Also, common is that the created logs do not leave the environment where the software runs. The localization of log data makes it difficult to put the log data into context, and it hinders access to log data when the environment is not available any more.
An example of this are the log files of the web server being isolated from the database logs and the IP-router logs, preventing to determine how quick the content of the website is presented to the end-user, and limiting the determination of the bottleneck in the response time. And when the web server crashes beyond restart, then it is “impossible” to determine what caused the crash.
- Tip – Log not only for the expected, but also for the unexpected.
- Tip – Log system metrics into another database as the application log data.
- Tip – Have the log environment in another context as the application and infrastructure the logs generate.
This is why it is good practice to move log data away from the environment where the IT solution is running. This can be done via an agent (software) that is running on the IT systems that read and sends the data to a central logging and monitoring environment. An alternative is that the IT Solution itself sends the log data to a service in the network that is listening.
It is a good practice to have the logs scanned for possible Personal Identifiable Information (PII) and try to apply data-segregation in combination with Attribute-Based-Access-Control (ABAC), in complaince with the GDPR.
Monitoring Log Levels
For monitoring, you can define the following layers of abstraction to monitor on. This list below goes from low level to higher level of abstraction. The higher a level the more “value” is monitored.
This list is related to Application Performance Monitoring Wikipedia CIO-Wiki
- Metric data from the infrastructure level.e.g. CPU, Storage, I/O, …
- Metric data from the application component level.e.g. Transactions per second, start/stop time, …
- Functional log data from the application component level.e.g. calling of sub-routines, calling of interfaces, error and warning information, …
- Meta-data from the application component level, providing insight into relationships.
- Enabling insight in the relationship between infrastructure components and applications components.
- Enabling insight in the relationship between application components.e.g. this can be done via logging a UUID retrieved from the parent that called you, and also log the calls going outside to your child-process. This way you can daisy-chain (correlate) the application processes over the application components.
- Meta-data from the user defined business transaction level,
- Enabling determining the business impact of the change/ malfunction in an application or infrastructure component.
- Enabling the visualization and analysis of business process based on data-mining e.g. by adding a field parent process name to the log entry, and when needed, you can change the process name to a sub-process when calling your own child processes. This text-value is additional to the UUID, since it gives business meaning to the process-flow, that you found by correlating the UUID’s.
- Meta-data from (synthetic) end-users
- Enabling the visualization and analysis of end-user experience and related this to business impact and relation to application components. E.g. Trigger from a specific end-user interface and connection a business process, that you run periodically (from once a day to multitple times per minute), to monitor the end-user performance of your solution as a whole.
- Tip – Determine why you are logging so that you can decide what to log.
There are many tools that can assist in one or more of these monitoring levels. It is common to start with a metric based log dashboard and evolve to include log stores and graph databases. The awesome observability list on the GitHub page of Adrian Novegil provides a very nice list and ordering of the available solutions.
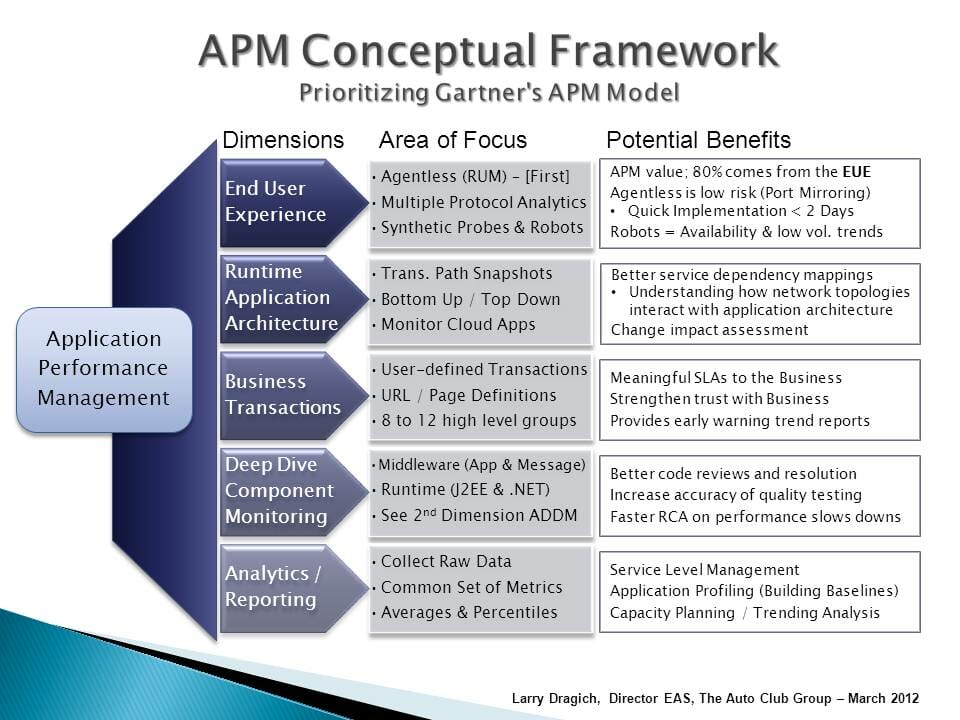
Monitoring Log Levels & Application Performance Management (APM) Conceptual Framework
The six (6) log levels of monitoring are similar to the steps in the APM Conceptual framework, but a bit more concrete.

APM Conceptual Framework Image from Wikipedia
Monitoring Maturity
Monitoring relies on logging. The following maturity levels define the value monitoring adds to the PDCA or OODA cycles.
- Gather data.
- Extract data out of the infrastructure or application component
- Send data into another environment for monitoring purposes.
- Transform data into information.
- Combine the data with context
- Visualize the data for the responsible and accountable stakeholders (users).
- Transform information into events.
- Determine based on the information a bandwidth or thresholds, that, when passed, will result in an event.
- Notify the stakeholders that are actionable of the event and provide them with relevant data.
- Automate the response to events.
- Auto Response to events and send logging of the event detection and response to the actionable people.
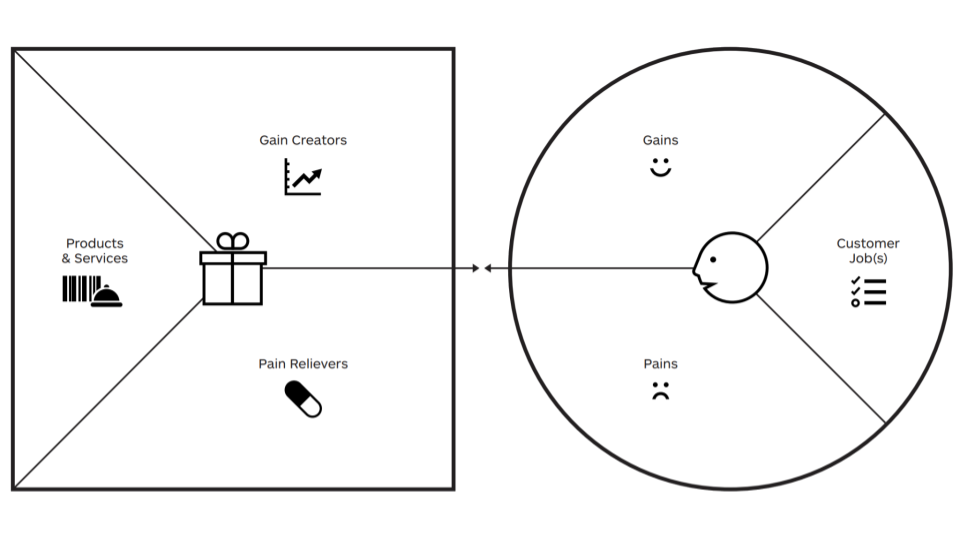
When you are able to automate responses, then you will gain a certain level of peace of mind that will provide you some headspace. This headspace will allow you to shift your response from redesign the construction (the how of your solution) to the redesign of the function (the what of your solution). Freedom to redesign the function of your solution will enable you to improve the value proposition of your solution. Since you can change and in this change you can reevaluate.

The value proposition canvas from Alexander Osterwaler and Strategyzer
Monitoring parties
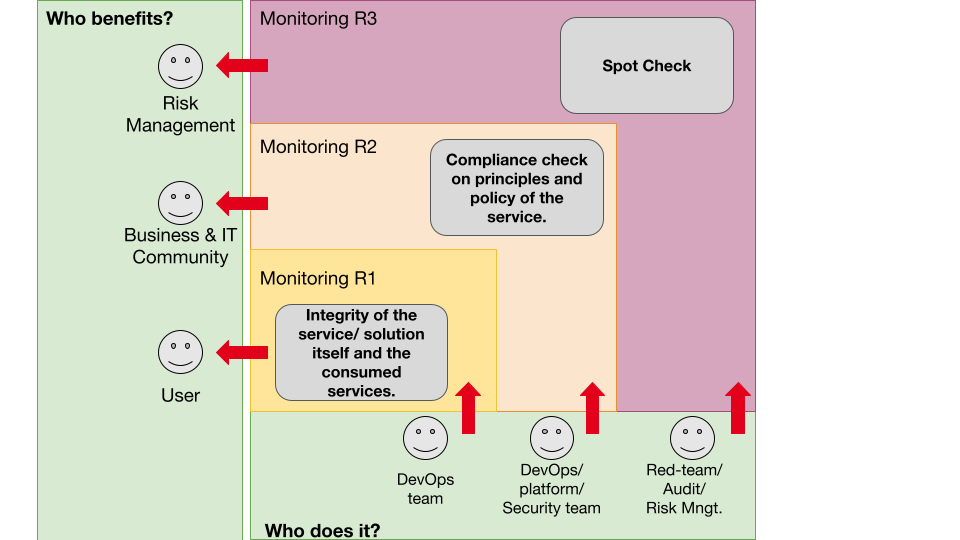
It is good practice to have more than one responsible party for monitoring purposes. Multiple layers of responsibility will reduce the number of unrecognized events and will help in preventing undesired side effects. Models for inspiration are the Viable Systems Model or the Three lines of Defence model.
In the context of an IT team operating a Solution in the cloud, this would imply that the team itself is responsible for monitoring and logging. This is the approach of Secure Software Development Lifecycle and DevSecOps as for example defined by the Department of Defence in the USA.
A second team is responsible for the security of the cloud environment, monitors from the perspective of the cloud platform. A third level could be a chaos engineering team or red team that checks the monitoring and event management that is in place by the IT team and cloud platform team.
Three lines of responsibility at Monitoring
To be secure, you need to validate your expectations with the reality as described in our white paper on BRACE, and in this lecture: “The security mirage” by Bruce Schneier
The challenge here is that the observation of reality is subjective. As presented in previous lectures:
- (1) Embrace chaos and antifragility at the Risk and Resilience 2022-11 festival by Marinus J. Kuivenhoven and Edzo A. Botjes (Google Presentation),
- (2) Embrace chaos and gain value by continuous learning at PROMIS 2022-11 symposium (Google Presentation),
- (3) Situational design guest lecture at the Antwerp Management School 2022-10 (Google Presentation),
- (4) Introduction into Security guest lecture at Nyenrode Business University 2022-05 (Presentation) and
- (5) Optimizing resilience towards antifragility a secure cloud translation at OWASP Benelux 2022-04 (Google Presentation).
For more examples of our subjective observation, you can visit the website of the Japanese professor: Akiyoshi Kitaoka Akiyoshi’s illusion pages. Monitoring therefore needs to be done from multiple perspectives to counter the subjectivity. A way of visualizing these three levels of responsibilities would be the following:

Call to action
So where to start?
My advice would be to start with the four tips, then look at your monitoring log levels and monitoring maturity and start to create your balanced stack of user stories. I personally would advise looking into an open source metrics monitoring solution that has integrated database and dashboard, and after implementing this quickly add a graph database including dashboard to it. The sooner you can show the business process to your stakeholders, the easier it is to determine the value of what of your monitoring solution.
Creating a context diagram or a threat-model helps in identifying your solution components, external systems, stakeholders and their relationships. Then when you have a feeling you are on the right path you can introduce (controlled) chaos, to train your system and adapt.
Summary
TL;DR
Monitoring Tips
- Tip – log not only for the expected, but also for the unexpected.
- Tip – log system metrics into another database as the application log data.
- Tip – have the log environment in another context as the application and infrastructure the logs generate.
- Tip – determine why you are logging so that you can decide what to log.
Monitoring Levels
- Metric data from the infrastructure level.
- Metric data from the application component level.
- Functional log data from the application component level.
- Meta-data from the application component level.
- Meta-data from the user defined business transaction level.
- Meta-data from (synthetic) end-users.
Monitoring Maturity
- Gather data.
- Transform data into information.
- Transform information into events.
- Automate the response to events.
White paper on resilience and IT Security
In other blogs, we will go into more detail on monitoring and its relation to resilience and to (IT) Security. You can read more about it in our white paper: “Introduction to the BRACE Model – Metamodel on Secure Product Development”, download requires no login.
Sharing Knowledge
Xebia’s core values are: People First, Sharing Knowledge, Quality without Compromise and Customer Intimacy. That is why this blog entry is published under the Licence of Creative Commons Attribution-ShareAlike 4.0 (CC BY-SA).
Regards Edzo Botjes


