
Monitoring is an important part of maintaining the reliability, availability, and performance of your ECS workload. You should collect monitoring data from all of the parts within your architecture so that you can more easily debug a multi-point failure if one occurs.
Lets visualize first
Before diving into the implementation we should first visualize the setup, at least, I always prefer to plot out a diagram of how it should end up. You'll immediately see that the setup is pretty simple and straight-forward, by looking at the title of this article and the below diagram you might already have figured it out. Good for you, stick around though.
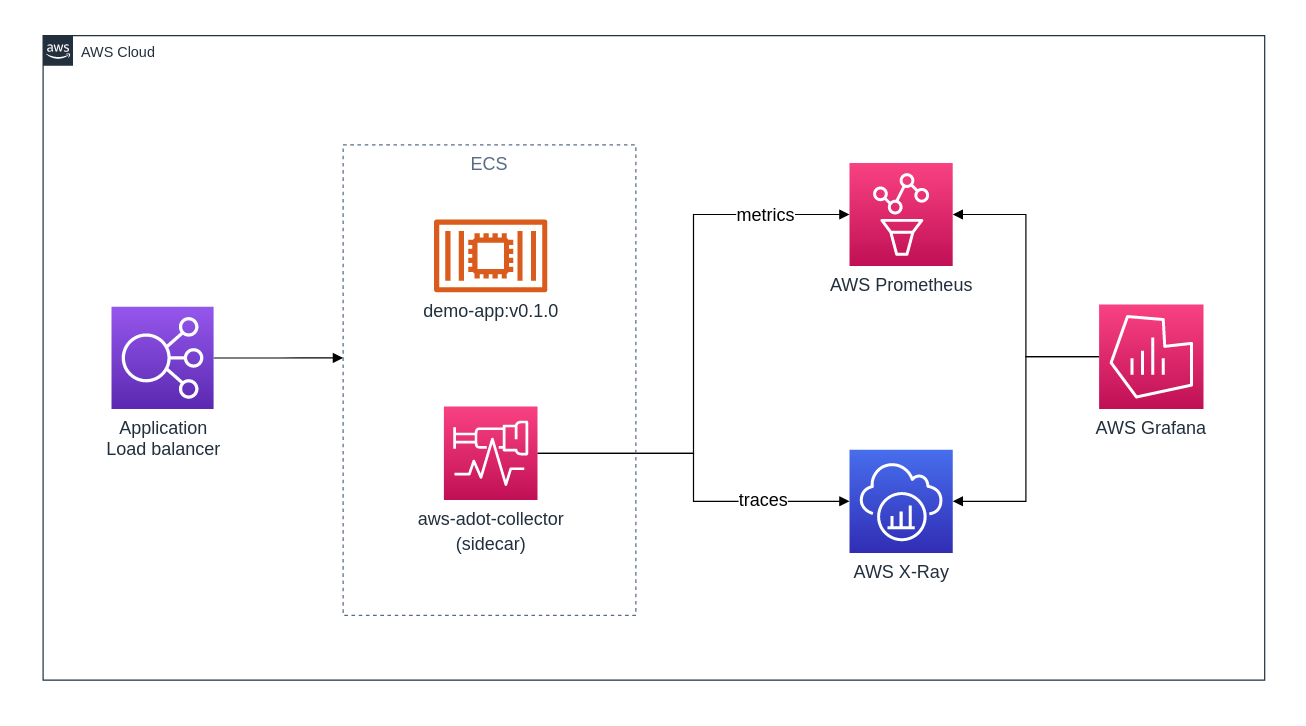
We can conclude a few things here. First, It looks like there's a second container that runs the AWS Distro for OpenTelemetry, which is a tool that collects metrics/traces and publishes it to somewhere. In our case that's a managed AWS Prometheus service and AWS X-Ray. Secondly, it looks like Grafana is consuming both Prometheus and X-Ray.
AWS OTel Collector
The AWS Distro for OpenTelemetry Collector (I'll refer to this as AWS OTel Collector or ADOT Collector throughout the article) is a AWS supported version of the upstream OpenTelemetry Collector and is distributed by Amazon. It wraps both around docker stats (shows CPU, memory, etc) and the ECS Task Metadata Endpoint (AWS exposes a local metadata endpoint in every container showing information related to the task)
As you can see in the preceding diagram, the AWS OTel Collector is a sidecar container. It's a container that runs alongside every service we deploy. (Essentially every service has its own task definition and in that task definition we define 2 containers, 1 for the application and 1 for the AWS OTel Collector, our sidecar).
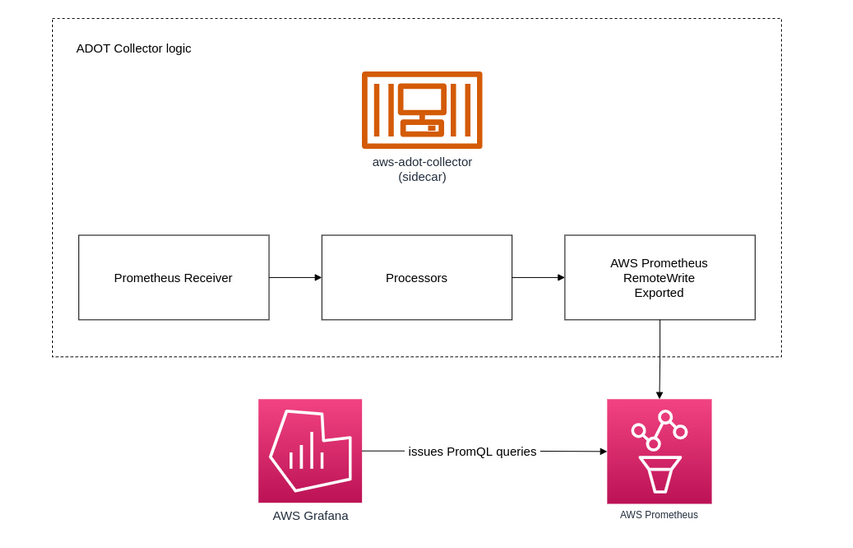
After a few hours reading through scattered source code and documentation on Github in order to try and piece parts of documentation together I figured out how it sort of works under the hood. The OpenTelemetry collectors implement a Prometheus remote write exporter. Whereas the collector is a common metrics sink in collection pipelines where metric data points are recieved and quickly "forwarded" to exporters. It looks and does a bit as following, if I understood correctly: (Bare in mind as the ADOT Collector is using the concept of pipelines, there's more plugable components in the ADOT Collector, e.g. the X-Ray receiver/exporter).
Please note, if the above is too abstract, don't worry - It was just out of excitement that I went to take a look at how this actually worked under the hood. There's some documentation available on: aws-otel.github.io/docs. Also, I'm using the terms ADOT Collector and AWS OTel Collector interchangeably, both refer to the same.
The sidecar in action
Now that we've got a good idea of what needs to be build, lets get to work. Before deploying our ECS service, we need to tick off a few prerequisites. I expect that you can set these up yourself, or just pretend and continue to read.
Prerequisites
-
ECS IAM role with the the following managed IAM policies AWSXrayWriteOnlyAccess, AmazonECSTaskExecutionRolePolicy, and AmazonPrometheusRemoteWriteAccess.
Note, AWS Prometheus automatically scales as your monitoring needs grow. It offers highly available, multi-AZ deployments.
Sidecar & Container definition
Assuming you've created a task definition and pre-configured the container definition with your application. Lets add an additional container to the container definition. We'll make use of a pattern called the sidecar pattern. Remember, the sidecar is a container that lives along side your application as a separate container. When we're talking containers, a container should do one thing, and a sidecar should do another. In our case the sidecar is good at, anything that the ADOT Collector does (data ingestion), our application really shouldn't be the one that does that heavy lifting!
For the sidecar container set the following values in the container definition:
- Image: public.ecr.aws/aws-observability/aws-otel-collector:latest
- Command: --config=/etc/ecs/ecs-amp-xray.yaml
- ENV: AWS_PROMETHEUS_ENDPOINT = value should be the remote write endpoint from the AWS Prometheus workspace you just created.
The sidecar container should look as following:
      {
          "name": "aws-otel-collector",
          "image": "public.ecr.aws/aws-observability/aws-otel-collector:v0.14.1",
          "cpu": 0,
          "links": [],
          "portMappings": [],
          "essential": true,
          "entryPoint": [],
          "command": [
              "--config=/etc/ecs/ecs-amp-xray.yaml"
          ],
          "environment": [
              {
                  "name": "AWS_PROMETHEUS_ENDPOINT",
                  "value": "https://aps-workspaces.eu-west-1.amazonaws.com/workspaces/ws-3e63f902-e43a-40d0-a86e-1a47d16a6a71/api/v1/remote_write"
              }
          ],
          "mountPoints": [],
          "volumesFrom": [],
          "dnsServers": [],
          "dnsSearchDomains": [],
          "dockerSecurityOptions": [],
          "dockerLabels": {},
          "logConfiguration": {
              "logDriver": "awslogs",
              "options": {
                  "awslogs-create-group": "True",
                  "awslogs-group": "/ecs/ecs-aws-otel-sidecar-collector",
                  "awslogs-region": "eu-west-1",
                  "awslogs-stream-prefix": "ecs"
              }
          },
          "systemControls": []
      }
Note, associate the ECS IAM role you've created as a prerequisite with the task definition. (I'm using the same role for both the Task role and the Task Execution Role).
Deploying the ECS Service
Create the ECS service, be sure that the ECS service is not going to register the AWS OTel collector as target in any target group (you should've prevented this by not assigning any port mapping to the sidecar container). Perform a few requests to generate some traffic so the AWS OTel collector pushes metrics to our AWS Prometheus instance and X-Ray.
Assuming everything went ok, you should see some sidecar container logs.
2021-11-26T13:46:18.772Z info service/collector.go:132 Everything is ready. Begin running and processing data.

2021-11-26T13:46:18.772Z info service/telemetry.go:116 Serving Prometheus metrics {"address": ":8888", "level": "basic", "service.instance.id": "92c6a1bf-99f5-4357-8319-7f79893962db", "service.version": "latest"}
X-Ray
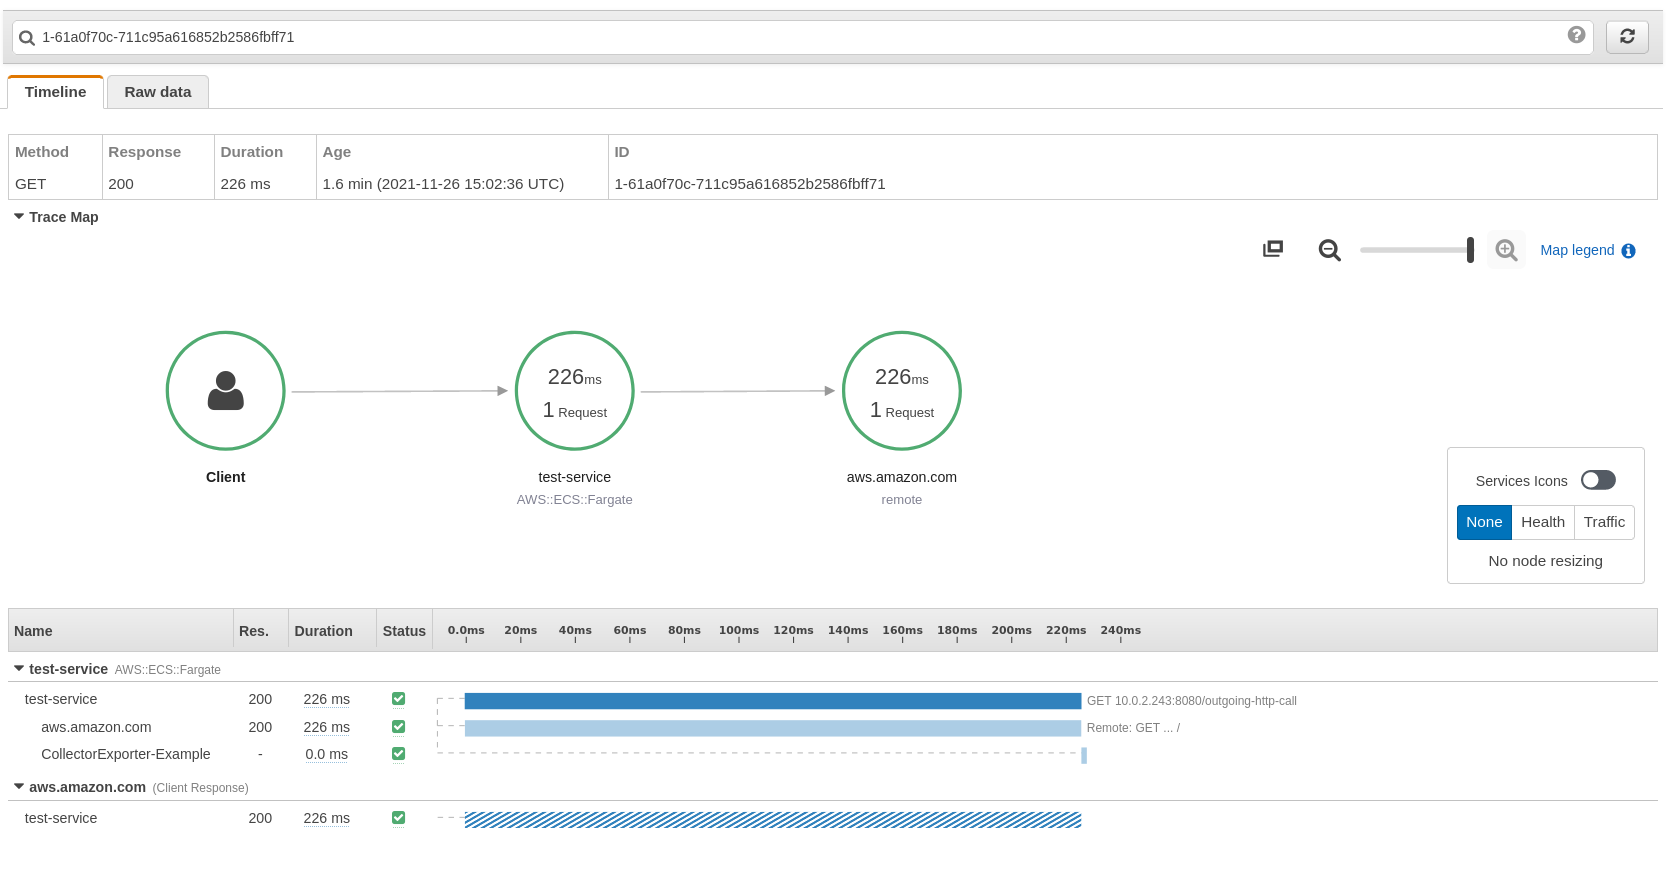
By default, the AWS Distribution for the OpenTelemetry Collector has enabled exporting to AWS X-Ray without any additional configurations - converting the AWS X-Ray OTLP formatted trace data to the AWS X-Ray format and then exports this data to the AWS X-Ray service.
Grafana
Grafana is a great way to visualize your metrics. You can spin up a AWS Managed Grafana workspace in less than 5 minutes and hook up AWS Prometheus as a data source. I would recommend reading up on configuring data sources in Grafana.
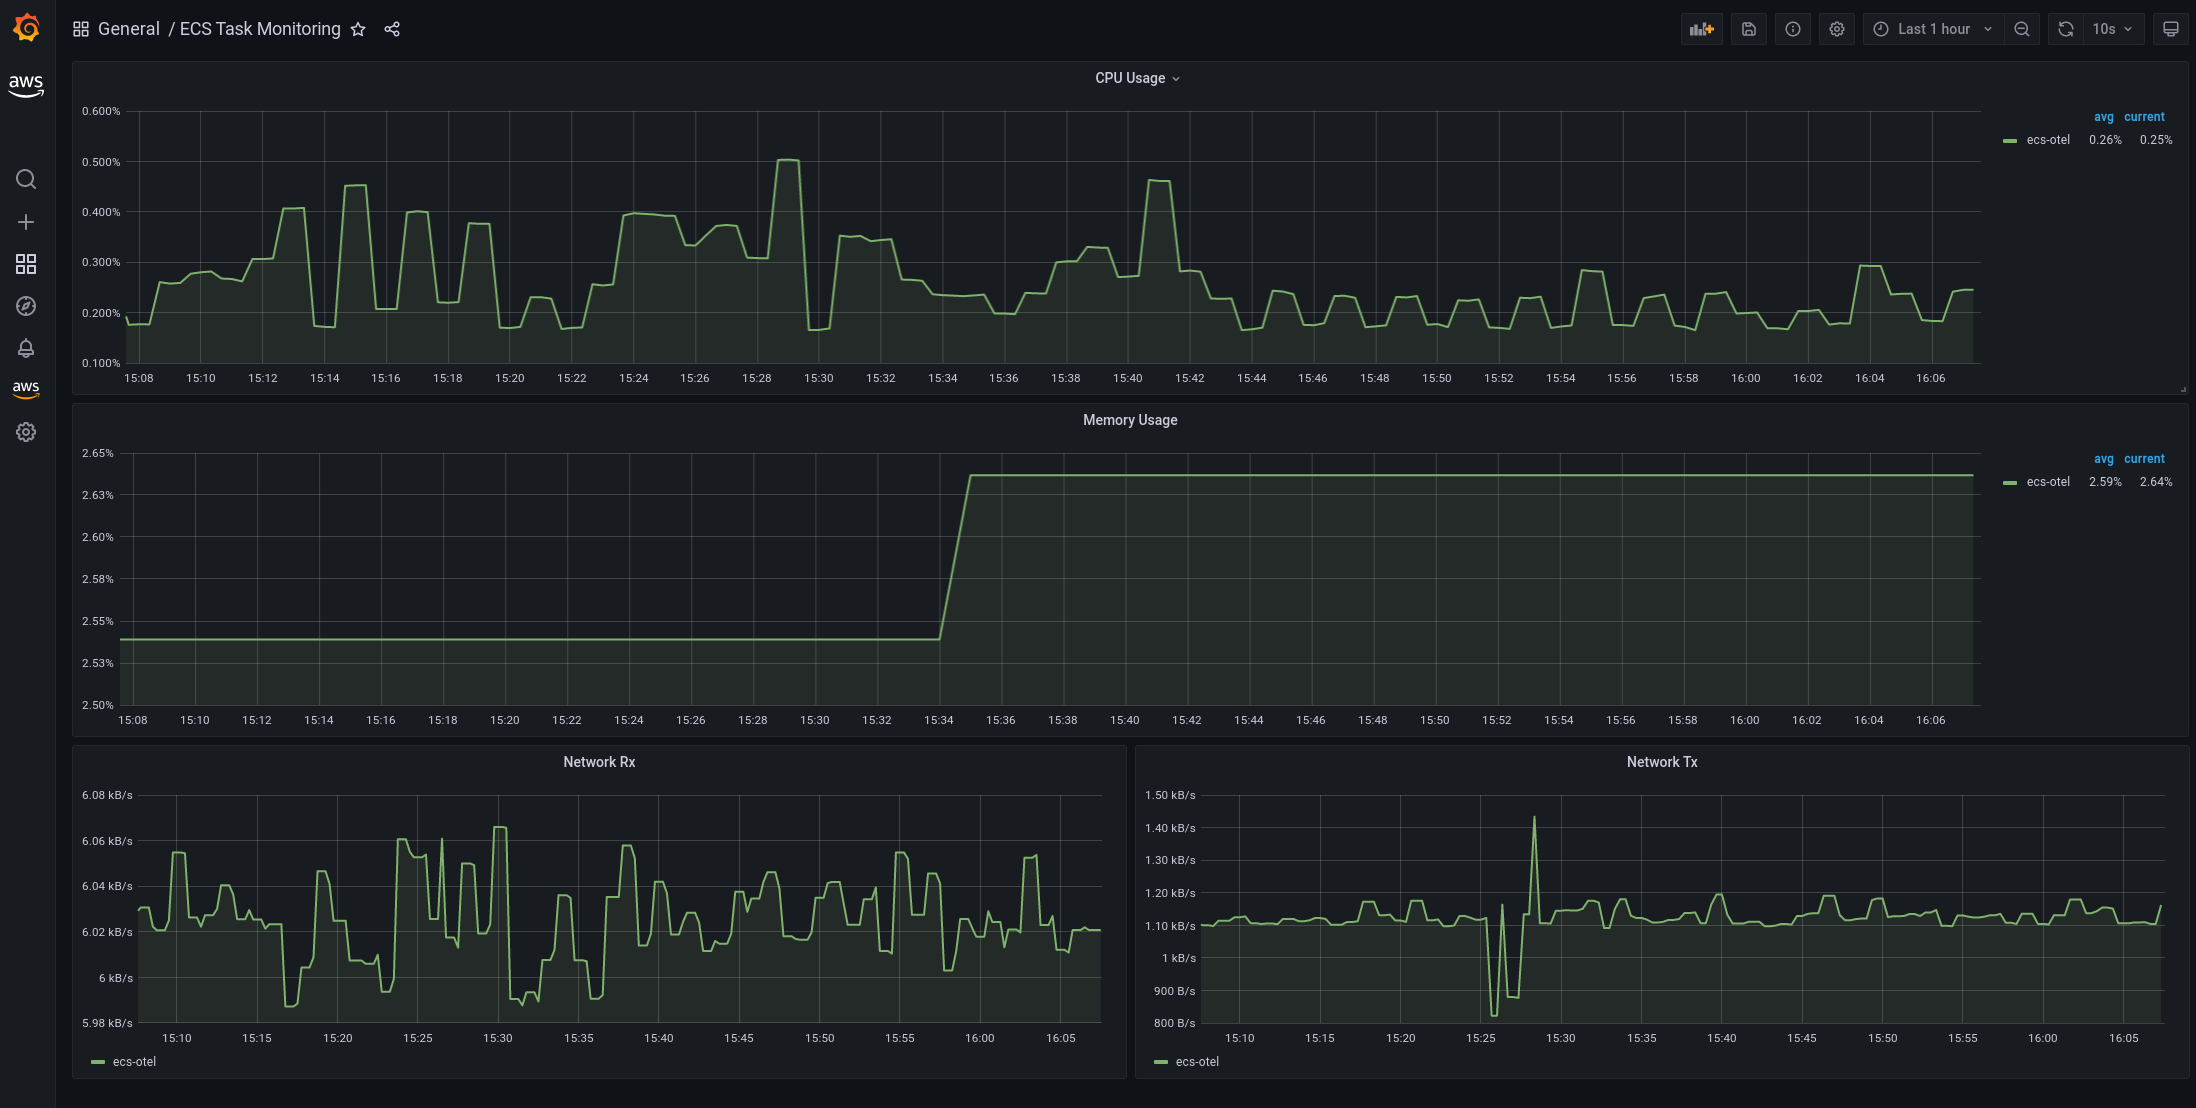
Grafana has a steep learning curve when it comes to configuring dashboards and data sources. I highly recommend following the As Code approach with Grafana, the AWS Observability team rolled out a nice article on using the Grafana Terraform provider. You can also create your own custom dashboard using PromQL by creating a custom dashboard and adding a panel connecting AMP as the data source.
curl https://raw.githubusercontent.com/aws-samples/ecsdemo-amp/main/grafana/AMP_ECS_Task_Monitoring.json -o AMP_ECS_Task_Monitoring.jsonIf you would like to get a kick-start, the above should yield you dashboard the same as I had setup above.
Footnotes
-
I would recommend to configure alerting in Prometheus and/or making use of unified alerting which Grafana released in 8.0.
-
Deploy a sidecar container with every task, always keep in mind separation of responsibility when working with containers.
-
Both Grafana and Prometheus are available as docker images.
Written by

Bruno Schaatsbergen
Bruno is an open-source and serverless enthusiast. He tends to enjoy looking for new challenges and building large scale solutions in the cloud. If he's not busy with cloud-native architecture/development, he's high-likely working on a new article or podcast covering similar topics. In his spare time he fusses around on Github or is busy drinking coffee and exploring the field of cosmology.


Contact