Applications generate all sorts of logs. Sometimes these logs tell something about how the application is functioning. For example: when error logs pop up, your application might be facing issues. We are going to take a look at how you can get alerted on application logs on the Google Cloud.
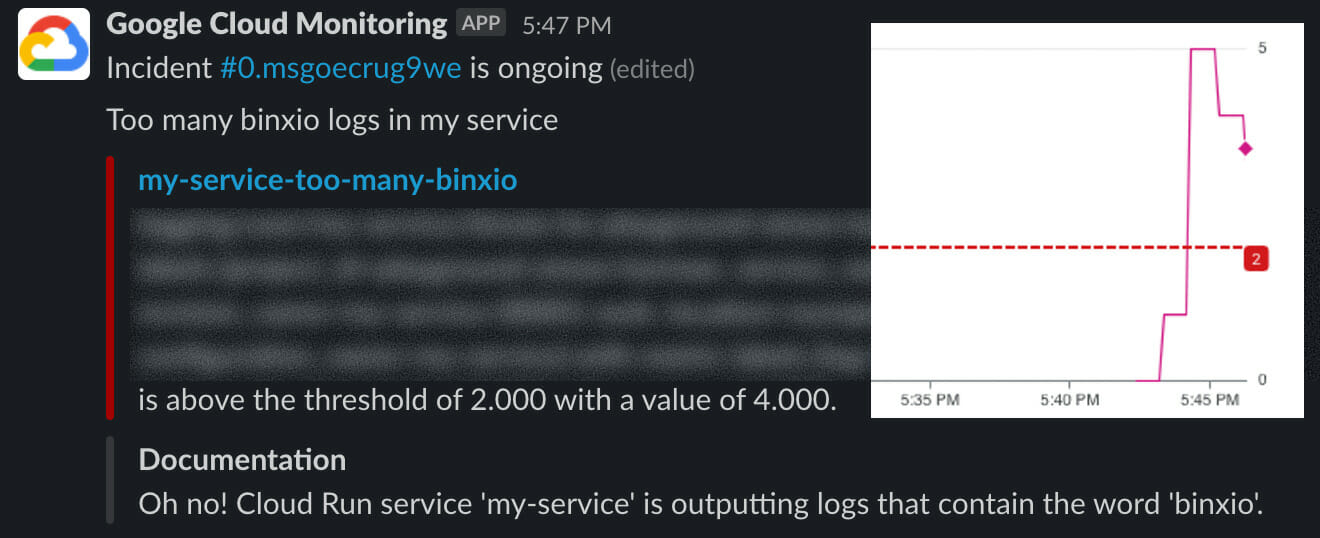
The scenario we’re looking at is: How to get notified via Slack when a Cloud Run service is outputting logs that contain the word ‘binxio’?
In a nutshell
We’re going to create a logs-based metric and then we’ll add a notification channel to setup an alert definition.
Logs-based Metrics
First we need to create our logs-based metric. Logs-based metrics derive metric data from the content of log entries. For example, when your application logs every incoming HTTP request you can use a logs-based metric to count the number of log entries that resemble a POST request.
For our example we’re going to use a counter metric. A counter metric counts the number of log entries matching a given filter. For our cloud run service we are interested in all logs from the specific Cloud Run service that contain the word ‘binxio’.
resource "google_logging_metric" "binxio_logs_metric" {
  name   = "my-service/binxio"
  filter = "resource.type=\"cloud_run_revision\" AND resource.labels.service_name=\"my-service\" AND \"binxio\""
  metric_descriptor {
    metric_kind = "DELTA"
    value_type  = "INT64"
  }
}
Note: Don’t forget to replace each instance of
my-servicein the code snippet above with the service name of your Cloud Run service.
Notification Channel
Next we need a notification channel. We can create one for Slack in the Alerting Notification page in the Google Cloud Console by clicking on ‘Add New’. This will require you to login to Slack and authorize the Google Cloud Monitoring app to send messages to your Slack workspace.
You can use the following command to find the name of your notification channel. Please note it down, since we’ll need it later on.
gcloud alpha monitoring channels list --format="table(labels.channel_name,name)"
Alerting Policy
To tie everything together we have to create an alerting policy. An alerting policy describes two things: (1) the circumstances under which you want to be alerted and (2) how you want to be notified.
For the circumstances, the configuration essentially comes down to pointing at the metric we created and defining how it should be interpretted. A visual way to define the values you want to use in your configuration is to Create a Alerting Policy in the Google Cloud Console and then download its JSON definition afterwards.
For the notification, we have to point to the notification channel we just created. We can include documentation in markdown that will be added to the notification as additional text that can help identify how to resolve the incident.
resource "google_monitoring_alert_policy" "too_many_binxio_logs_alert_policy" {
  #1. Circumstances
  display_name = "my-service-too-many-binxio"
  combiner = "OR"
  alert_strategy {
    auto_close = "1800s"
  }
  conditions {
    display_name = "Too many binxio logs in my-service"
    condition_threshold {
      filter = "resource.type=\"cloud_run_revision\" AND metric.type=\"logging.googleapis.com/user/${google_logging_metric.binxio_logs_metric.name}\""
      comparison = "COMPARISON_GT"
      threshold_value = 2
      duration = "0s"
      aggregations {
        alignment_period = "60s"
        per_series_aligner = "ALIGN_MAX"
      }
    }
  }

  #2. Notification
  notification_channels = [ "<notification-channel>" ]
  documentation {
    content = "Oh no! Cloud Run service 'my-service' is outputting logs that contain the word 'binxio'."
    mime_type = "text/markdown"
  }
}
Note: Don’t forget to replace each instance of
my-servicein the code snippet above with the service name of your Cloud Run service and to replace<notification-channel>with your notification channel name.
Receiving the notification
Now if messages containing the word ‘binxio’ are outputted in your application logs, the metric value will be updated. If the value rises above the given threshold value an incident will be created in the Google Cloud Console and a notification will be sent to the notification channel.

Conclusion
We have created a logs-based metric for a Cloud Run service, added Slack as the notification channel and then setup an alert to trigger when a certain threshold of errors is hit.


